

Static public benchmark scores rarely predict production performance. Benchmark contamination can range from 1% to 45%, and reported accuracy gains can reach 14 percentage points on some datasets, so the highest leaderboard score may reflect test exposure rather than durable capability.
A reliable AI model comparison therefore needs three layers: representative task evaluation, controlled measurement of uncertainty and failure modes, and production testing for latency, cost, and resilience. A model that wins a clean academic test can still lose in deployment when prompts are paraphrased, enterprise data is incomplete, or an upstream service degrades.
Table of Contents
- Deconstructing the Traditional Model Selection Process
- Understanding the Mechanics of Modern AI Evaluation
- Evaluating Model Capabilities Beyond Raw Scores
- Latency, Cost, and Infrastructure Reliability
- Best Practices for Conducting a Rigorous AI Model Comparison
- Applying Strategic Selection in Production Environments
Deconstructing the Traditional Model Selection Process
The traditional selection process starts with the wrong question: Which model has the highest score? Engineering teams often treat a leaderboard as a proxy for capability, then discover that the ranking says little about whether a system preserves constraints across turns, handles missing information, or returns valid structured output.
Academic benchmarks are useful because they create common test conditions. They become dangerous when teams mistake controlled measurement for a complete description of production behavior. Clean prompts and fixed answer formats remove many of the conditions that make real applications difficult, including ambiguous requirements, proprietary terminology, incomplete context, user typos, and changing workflows.
Why rankings create false confidence
A public score can hide several sources of uncertainty:
- Contamination: A language model may have encountered benchmark questions during pretraining, making test accuracy partly a measure of exposure.
- Prompt sensitivity: Small wording changes can alter results, even when the underlying task remains the same.
- Saturation: Mature evaluations may leave little headroom, so a nominal lead can represent measurement noise rather than a meaningful capability difference.
- Workflow mismatch: A benchmark may reward an answer, while a production system must ask a clarifying question, call a tool, follow a policy, and recover from an error.
The distinction matters most when candidate models are close. If one system leads another by a small margin, the result shouldn't drive a major architecture decision unless repeated trials, uncertainty estimates, or significance testing show that the difference is stable. BetterBench's assessment of AI benchmark quality found that most evaluated benchmarks didn't report statistical significance, while very few provided scripts that made replication easy.
Practical rule: Treat a leaderboard as a screening instrument, not as a deployment verdict.
Production success is a different target
A useful comparison measures workflow success, not just factual accuracy. For a document-processing agent, that might mean preserving field constraints, refusing unsupported claims, producing parseable JSON, and escalating uncertain cases. For a coding assistant, it might mean passing repository tests without introducing regressions and identifying when the requested change is underspecified.
This reframes model selection as an engineering experiment. Start with public evaluations to eliminate obviously unsuitable candidates, then test private and recently created examples that resemble actual traffic. Vary prompt wording, language, user behavior, and context quality. Record not only whether the final answer is correct, but also whether the model failed safely.
The counterintuitive conclusion is that a lower-ranked general model can be the stronger choice for a narrow workflow. Consistency on representative inputs, predictable abstention, and stable behavior under load may create more business value than a small advantage on a saturated public test.
Understanding the Mechanics of Modern AI Evaluation
Static benchmark wins stop mattering once the test no longer separates models that behave differently in production. That is why modern evaluation has shifted from single headline scores toward a closer examination of benchmark design, saturation, contamination risk, and measurement uncertainty.
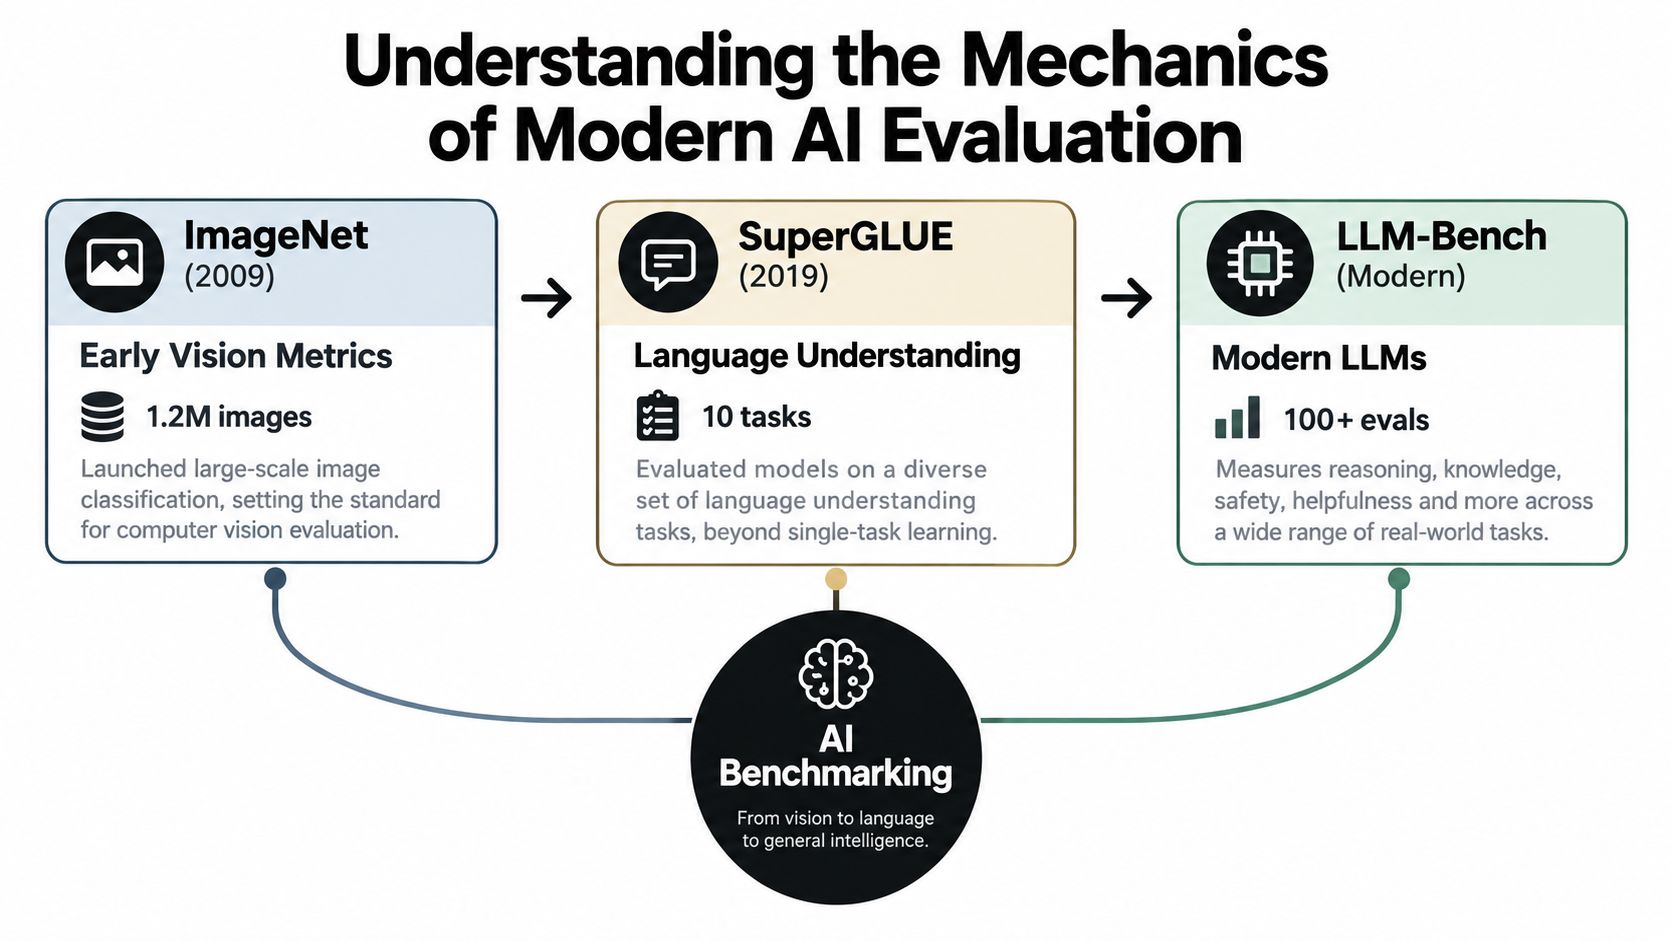
AI benchmarking evolved for a practical reason. Fixed tasks eventually stop distinguishing useful systems. ImageNet, created in 2009, contains more than 14 million images organized across roughly 20,000 categories. It established terms that still shape evaluation today: top-1 accuracy measures whether the highest-probability label is correct, and top-5 accuracy measures whether the correct label appears among the five highest-probability predictions. Stanford's review of benchmark saturation explains why those definitions mattered, and why a single score eventually becomes insufficient for model comparison.
Saturation changes the meaning of progress
Stanford's review of approximately 50 benchmarks found that many mature evaluations are approaching saturation. The leading ImageNet image-classification system reached about 91% accuracy in 2021, while the improvement in 2022 was only 0.1 percentage points. Those figures do not show that research stalled. They show that once a benchmark becomes familiar, narrow, or close to its ceiling, additional gains may say less about practical capability than leaderboard position suggests.
Language evaluation followed the same pattern. SuperGLUE, released in May 2019, replaced GLUE after systems began to saturate the older benchmark and combined eight linguistic tasks into one aggregate score. Aggregate metrics improve comparability, but they also compress failure modes. Two models can post similar averages while breaking on different subtasks, which creates different operational risks once the model is embedded in a real workflow.
A mature benchmark should therefore be read through four lenses:
- Benchmark age: Older tests have had more time to enter training corpora or become explicit optimization targets.
- Task coverage: A narrow task, such as short-answer recall, does not represent tool use, long-context reasoning, or multi-step execution.
- Metric definition: Accuracy, calibration, ranking quality, and completion success measure different properties.
- Remaining headroom: A benchmark near saturation may no longer distinguish meaningful improvements.
Contamination and statistical uncertainty
Contamination is not uniform across datasets. On C-Eval, it was associated with larger measured gains. On HellaSwag, the effect was smaller. On MMLU, it was minimal in the reported experiments. That spread matters more than any single headline number because it shows that benchmark exposure can distort some comparisons while leaving others mostly intact, as examined in this contamination assessment and benchmark-quality analysis.
For engineering teams, the consequence is straightforward. A small benchmark lead is weak evidence until the evaluation setup shows how much noise surrounds the result. If decoding is stochastic, run repeated trials. Preserve prompts, model settings, and preprocessing. Report confidence intervals, or another explicit uncertainty measure, and inspect item-level disagreements instead of relying only on an average.
Teams also need tests that public leaderboards cannot provide. A private evaluation set created after the likely training cutoff reduces exposure risk. So do tasks built around current workflows, fresh documents, tool calls, and outputs that can be validated mechanically. Those checks get closer to the question: not whether a model scored slightly higher on a static benchmark, but whether it will remain reliable when inputs are messy, latency varies, and failures need to be handled safely.
A public benchmark records performance under a known protocol. A useful comparison estimates how much trust that result deserves.
Evaluating Model Capabilities Beyond Raw Scores
A production model has to be accurate, but accuracy is only one dimension of suitability. Stanford's HELM framework evaluates seven dimensions: accuracy, calibration, robustness, fairness, bias, toxicity, and efficiency. Its design is valuable because it forces teams to compare failure behavior alongside successful answers, using controlled scenarios and consistent prompting and adaptation strategies. Stanford's HELM framework provides the methodological foundation.
The scorecard should reflect the application
Consider three candidate profiles:
| Evaluation dimension | Model A | Model B | Model C |
|---|---|---|---|
| Accuracy | Strong aggregate score | Slightly lower aggregate score | Competitive on domain tasks |
| Calibration | Predictable confidence | Overconfident on edge cases | Requires calibration testing |
| Robustness | Stable under wording changes | Sensitive to paraphrases | Strong on noisy inputs |
| Safety behavior | Low harmful output rate | More frequent inappropriate completions | More frequent refusals |
| Efficiency | Suitable for interactive use | Higher reasoning overhead | Efficient in batch workflows |
This table isn't a leaderboard. It's a decision template. The right outcome depends on the cost of each failure. A customer-support system may prefer a model that abstains when evidence is missing. A research assistant may accept greater latency for deeper reasoning. A classification pipeline may value calibration because downstream automation uses confidence thresholds.
Separate capability from reliability
HELM's dimensions shouldn't be collapsed too early into one weighted score. A weighted average can make a severe weakness disappear behind strong performance elsewhere. Instead, define hard constraints first, then rank the models that satisfy them.
For example, a team might require:
- Valid structured output for every accepted request.
- Stable behavior across representative paraphrases.
- An explicit abstention path when required evidence is absent.
- Acceptable fairness and toxicity behavior for the user population.
- Latency and cost within the application's service limits.
Only after those gates are passed should aggregate quality, efficiency, or preference scores decide between candidates.
Test the conditions that benchmarks remove
Run the same prompts with controlled variations:
- Replace terminology with the language used by actual customers.
- Remove a required field and check whether the model asks for it.
- Reorder context and introduce irrelevant documents.
- Continue the conversation across multiple turns.
- Compare outputs with and without tool definitions.
- Evaluate confidence against observed correctness.
Teams evaluating available candidates can use the Openbase model catalog as a discovery surface for models and capabilities, then run their own workload-specific tests. Catalog metadata can narrow the search, but it can't replace application evidence.
The key distinction is between answer quality and decision quality. A model may produce polished prose while making an unsafe commitment, dropping a constraint, or expressing unjustified certainty. A rigorous AI model comparison makes those behaviors visible before they become production incidents.
Latency, Cost, and Infrastructure Reliability
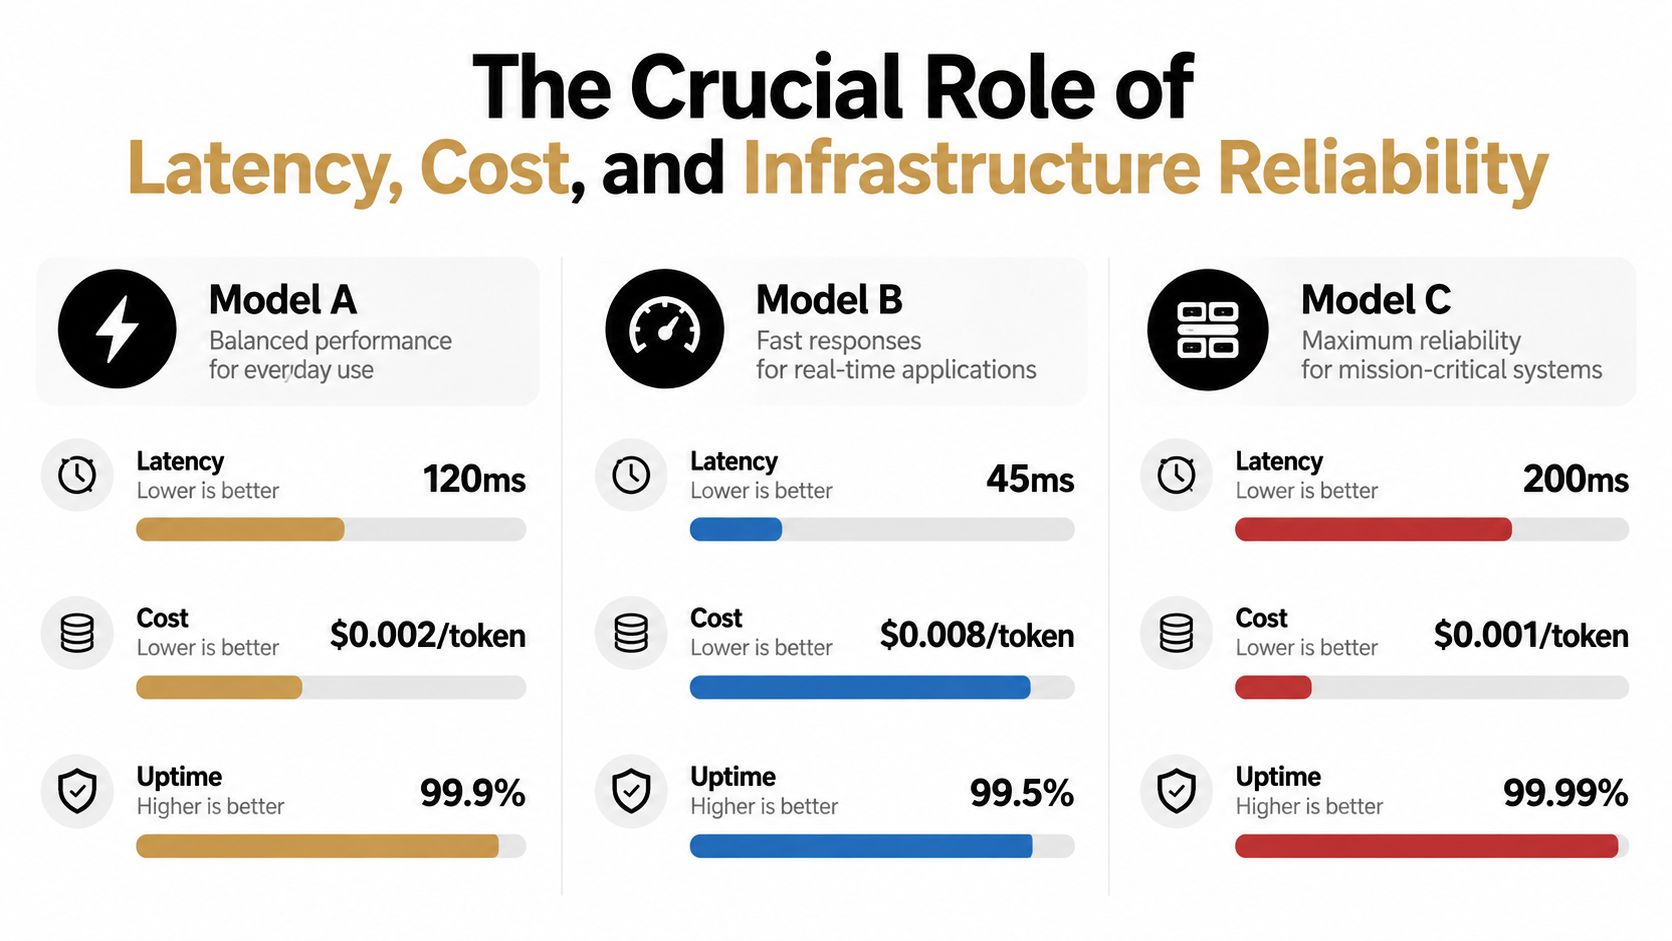
A model that wins on a leaderboard can still fail in production if users wait too long, if retry traffic magnifies an outage, or if the total workflow cost breaks the budget. Selection should reflect the full serving path, because benchmark rank does not capture tail latency, recovery behavior, or the infrastructure choices that determine whether a system stays usable under load.
Measure what users experience
Useful telemetry should separate the parts of latency that shape perceived quality:
- Time to first token, or TTFT: How quickly streaming begins.
- Time to first answer token: Important when a reasoning system spends time before showing visible output.
- Output speed: Tokens generated per second.
- End-to-end response time: The full duration from request to final output.
- Standardized generation time: The time needed to produce a fixed response length under a controlled workload.
Artificial Analysis methodology outlines standardized comparisons across intelligence, price, output speed, TTFT, end-to-end latency, and context-window size. Internal evaluation should report p50 and p95 latency, not only the average, because median performance can look fine while a smaller but meaningful share of requests misses user expectations.
Different workloads optimize for different latency profiles. An interactive assistant may prioritize TTFT because delay is visible immediately. Batch summarization may prioritize throughput and completed-task cost. A reasoning-heavy workflow should isolate reasoning-token consumption, since hidden generation time changes both latency and spend. This is one reason static benchmark scores travel poorly to production. They compress behavior into a single rank while operators must manage the tails.
Calculate cost per successful task
Per-token pricing is only one part of the economic model. The meaningful unit is cost per successful outcome. Calculate it from the full workflow, including input, cached input, output, and reasoning-token usage, then add retries, failed attempts, tool calls, caching effects, concurrency overhead, and human review where those costs exist.
That framing changes model comparisons. A lower nominal rate can become more expensive when the system needs more turns, more retries, or more manual cleanup. A higher-priced model can cost less per completed task if it resolves the request cleanly on the first pass.
Infrastructure choices can also reverse a price ranking. A cited analysis reported that purpose-built on-premises infrastructure delivered inference 2.6 times more cost-effectively than IaaS and up to 4.1 times more cost-effectively than a GPT-4o API under its stated assumptions. The Dell Technologies inference analysis shows why architecture, utilization, and workload shape belong in the comparison, rather than being treated as deployment details after model selection. For provider-side comparisons, Openbase pricing can serve as one reference point inside a broader workload-based cost model.
The following walkthrough shows how standardized latency and cost metrics are assembled side by side.
Reliability is a model-selection variable
Reliability deserves the same attention as capability. Record rate-limit responses, timeouts, upstream errors, retry outcomes, regional availability, and failover behavior. A service can post strong median latency and still miss user-facing objectives if tail behavior degrades during traffic spikes or partial outages. Retry policy also matters, especially when some requests may have triggered an irreversible side effect before the failure surfaced.
This leads to a more precise decision. Best model and best service path are different choices. Capability determines whether the model can do the work. Reliability, throttling behavior, recovery characteristics, and predictable economics determine whether it can keep doing that work in production.
Best Practices for Conducting a Rigorous AI Model Comparison
A credible comparison is a repeatable experiment, not a collection of screenshots from public leaderboards. The pipeline should preserve inputs, settings, outputs, timing, errors, and evaluation judgments so another engineer can reproduce the result and explain a change.
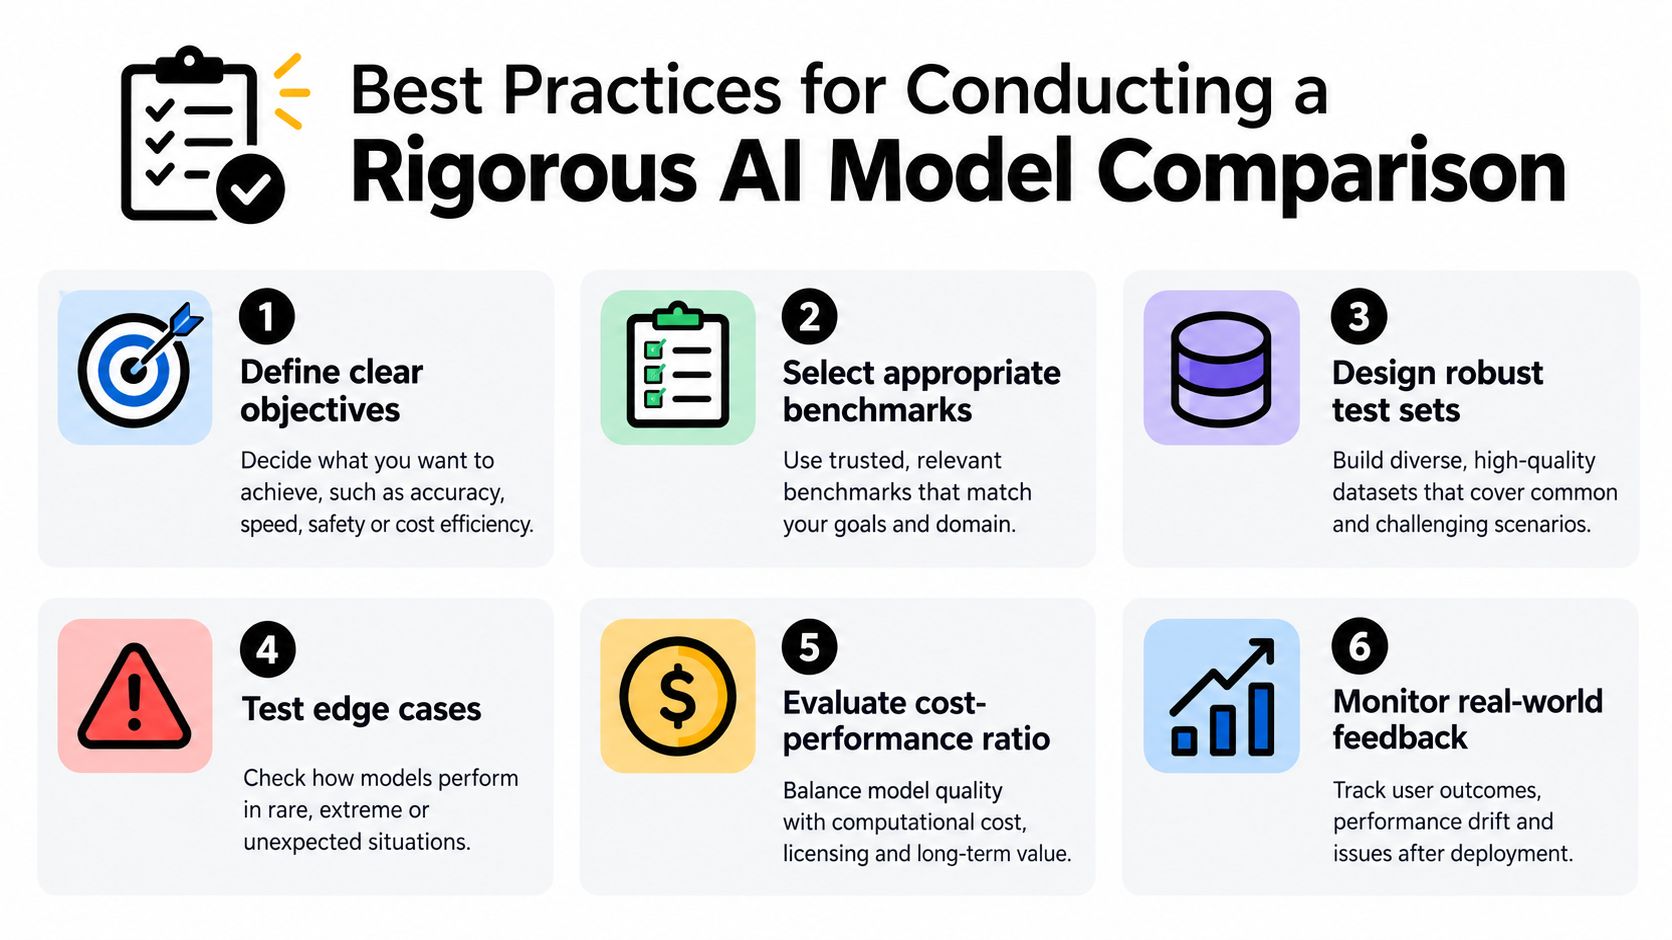
1. Define the decision before selecting tests
Write down what the system must accomplish and what failure means. “High quality” isn't an acceptance criterion. “Returns valid structured output, preserves required fields, and escalates unsupported requests” is testable.
Separate hard constraints from optimization goals. Safety failures, invalid schemas, or unacceptable availability may disqualify a candidate. Accuracy, latency, and cost can then distinguish the survivors.
2. Combine public and private evaluations
Use public benchmarks for orientation and comparability, but create a private set from representative production inputs. Include successful examples, ambiguous requests, incomplete records, long context, domain terminology, and known failure cases. Remove sensitive information or use controlled substitutes that preserve the relevant structure.
Hold out a recently created slice for final evaluation. Don't tune prompts against every example and then report the same examples as unbiased evidence.
3. Freeze the experimental conditions
Keep the following constant across candidates:
- Prompt templates and system instructions.
- Sampling parameters and response limits.
- Tool schemas and tool availability.
- Input documents and conversation history.
- Retry policy and concurrency.
- Output validators and post-processing.
If a model requires a different prompt to work, test that configuration separately and document the adaptation. Otherwise, the comparison confounds model capability with prompt engineering effort.
4. Measure more than pass or fail
Create a rubric that captures severity. A minor formatting defect shouldn't have the same weight as a fabricated financial conclusion or an unauthorized action. Track exact-match success where appropriate, semantic quality, schema validity, abstention, confidence calibration, and human correction effort.
Repeat sampled evaluations and quantify uncertainty. When scores are close, report the interval or trial variation instead of declaring a winner. Use item-level analysis to identify whether one model is better on the cases that matter most.
5. Load-test the service path
Run realistic concurrency and request-length mixes. Capture TTFT, p50 and p95 latency, output throughput, timeout rate, rate-limit responses, retry count, and failover outcomes. Measure cost using actual token accounting, including reasoning tokens and unsuccessful workflow attempts.
Test degradation deliberately. Temporarily remove an upstream route or introduce throttling in a controlled environment, then verify that fallback behavior preserves request semantics and doesn't duplicate side effects.
6. Establish a feedback loop
Evaluation ends only when monitoring begins. Sample production outputs, review high-severity failures, compare live distributions with the test set, and add new cases to a versioned regression suite. Watch for changes caused by prompt updates, provider revisions, traffic mix, and user behavior.
A useful release gate asks four questions:
| Gate | Evidence required |
|---|---|
| Capability | Representative task outcomes and error severity |
| Reliability | Tail latency, timeout, throttling, and failover results |
| Economics | Cost per successful task under realistic traffic |
| Governance | Safety, fairness, calibration, and audit records |
This process turns model comparison into an operating discipline. It also prevents a familiar failure mode: selecting a model once, then assuming its original evaluation remains valid as the surrounding system changes.
Applying Strategic Selection in Production Environments
Consider a high-stakes document workflow that extracts obligations from contracts and routes them for review. A public leaderboard may identify capable reasoning models, but it won't tell the team whether a model preserves clause references, distinguishes missing evidence from negative evidence, or remains stable when a document contains unusual formatting.
The team should begin with a representative evaluation set and define severity tiers. A missed low-impact metadata field is different from an incorrect obligation date. The system should reject malformed structured output, surface uncertainty, and route high-risk cases to a reviewer rather than completing the workflow without review.

A workload-specific decision
Suppose Model A produces the strongest aggregate answer quality but has a long latency tail. Model B is slightly weaker on difficult reasoning cases but responds consistently under concurrency. Model C is inexpensive and fast, yet often expresses high confidence when required evidence is missing.
The correct architecture may use all three:
- Model A handles complex documents and escalated cases where deeper analysis justifies added latency.
- Model B handles interactive review and routine extraction where predictable response time matters.
- Model C performs low-risk preprocessing, provided validation catches unsupported outputs.
That isn't indecision. It's routing based on task value and failure cost. A single universal winner would force every request into the same quality, latency, and economic profile.
Reliability changes the design
The production test must include upstream degradation. Engineers should measure whether a request can be retried safely, whether a fallback model preserves the output contract, and whether a partially completed tool action could run twice. The team should also monitor p95 latency and cost per successful case after launch, because averages can conceal the conditions that users experience during traffic peaks.
The Openbase model documentation can support an implementation that keeps model access and request handling consistent while engineers compare provider paths. The operational design still needs application-level validation, observability, and human review controls.
The most defensible selection is therefore a policy, not a model name. It specifies which workload goes to which model, what evidence permits a fallback, when the system abstains, and which telemetry triggers re-evaluation. That policy can change as traffic, prices, model behavior, or reliability conditions change.
A static leaderboard answers, “Who scored highest under this protocol?” A production evaluation answers the question stakeholders need: “Which service path completes our important tasks accurately, safely, predictably, and at an acceptable cost?”
Openbase provides a unified OpenAI-compatible API for accessing models from multiple providers, with consolidated billing, per-call token and cost logging, latency and TTFT visibility, and automatic failover options. Use those capabilities to run controlled workload tests and compare model quality with operational performance, then visit Openbase to evaluate the available integration.