
Your feature worked in testing. The prompt was fine, the model answered correctly, and the demo looked clean. In production, a user waits longer than expected, retries, gets a different answer, and burns twice the tokens for the same task. Your logs say the request succeeded. They don't tell you which step slowed down, which tool returned stale context, or why cost rose.
That's the gap AI observability tools are meant to close. You need requests, nested traces, token counts, latency, time to first token, errors, retries, cost, and quality scores tied to a specific prompt, model, provider, and application release. Without that chain, you're guessing whether you have a model problem, a retrieval problem, or a routing problem.
Adoption is still early. In Grafana Labs' 2025 Observability Survey of 1,255 practitioners, only 7% used LLM observability in production, extensively, or exclusively, while 47% were investigating it or building a proof of concept. That gap explains why tooling varies so much. Some products only log requests. Others trace full agent runs and turn failures into evaluations. The ten tools below are organized around where traces live, how tokens and latency are measured, how costs are attributed, and whether basic logging or full agent evaluation is the job.
Table of Contents
- 1. LangSmith
- 2. Langfuse
- 3. Arize Phoenix
- 4. Helicone
- 5. Braintrust
- 6. Datadog Agent Observability
- 7. LangWatch
- 8. Opik
- 9. Portkey
- 10. Galileo
- AI Observability Tools: Top 10 Comparison Matrix
- Choose a Monitoring Stack That Scales With Your Stack
1. LangSmith
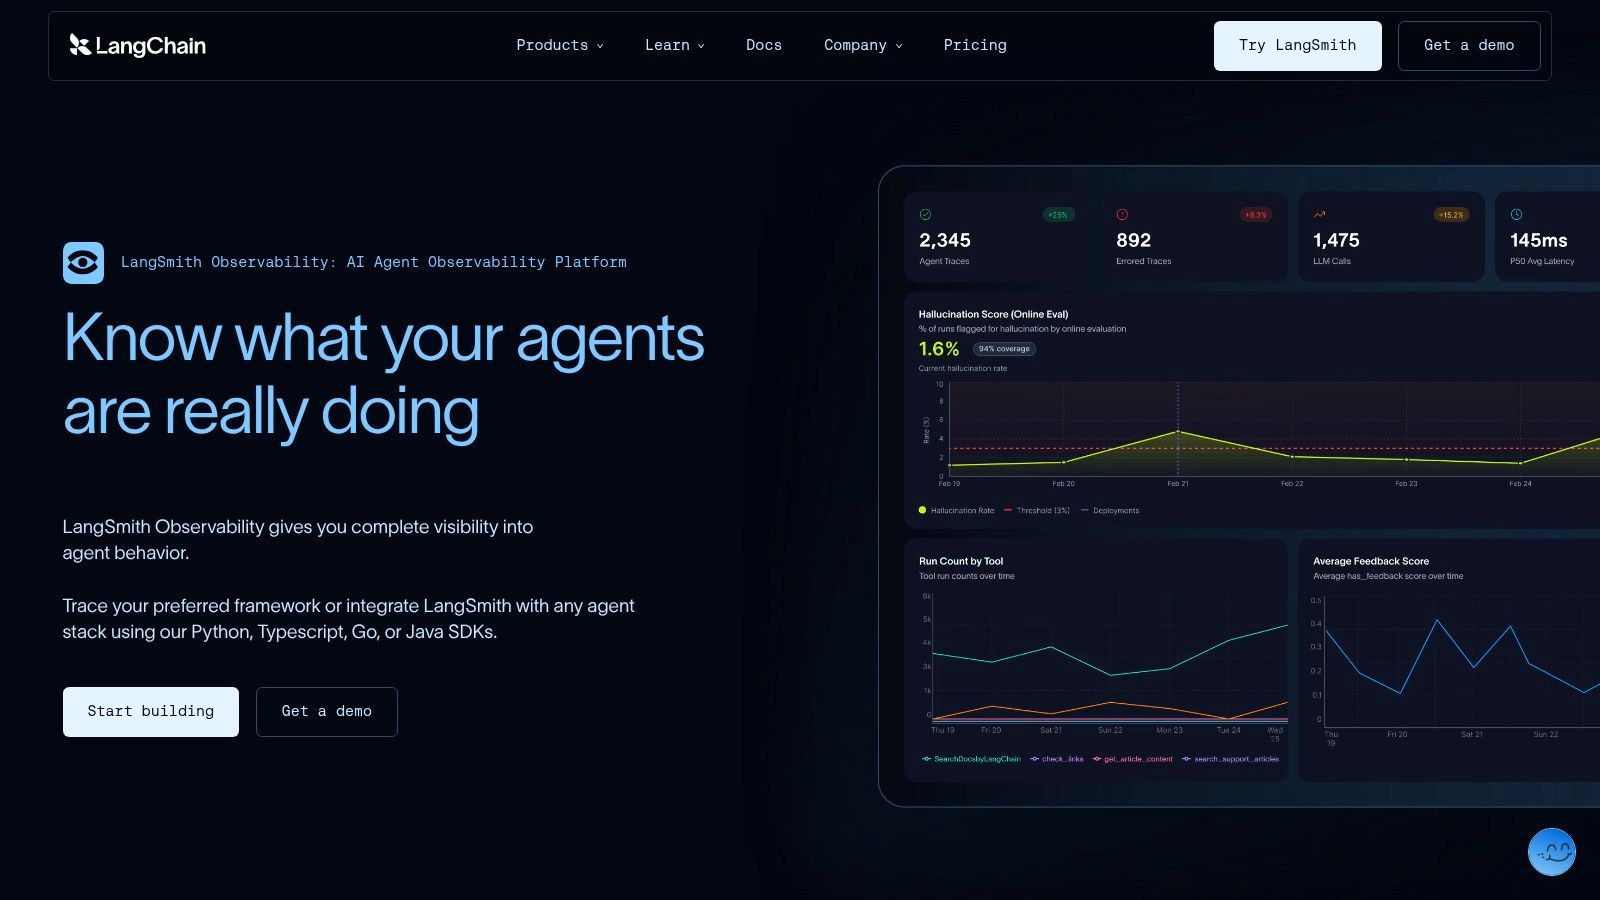
LangSmith is strongest when you need to reconstruct a multi-step run, not just check that a model call returned. It traces LLM calls, tool calls, and agent workflows, then connects those traces to datasets and evaluation experiments. It's built by LangChain, but it isn't limited to LangChain apps. Framework-agnostic tracing covers OpenAI and Anthropic SDKs and other stacks.
Where it fits in practice
The useful loop is production trace to test case. You find a bad run, save it, change the prompt or model, and rerun the evaluation instead of debating anecdotes. That matters when you're comparing providers or models available through Openbase's model catalog and need evidence beyond a few manual prompts.
- Tracing depth: Nested runs make branching agents easier to debug than flat request logs.
- Evaluation link: Datasets and experiments sit next to production monitoring.
- Pricing reality: The Developer plan is free for up to 5,000 base traces per month, and Plus starts at $39 per seat per month, with usage charges on top.
The trade-off is cost modeling. Seat pricing plus usage gets harder to forecast as trace volume grows, and the free plan is limited to one seat. Teams that require fully self-hosted deployment should evaluate Enterprise options early, not after instrumentation is finished.
2. Langfuse
Langfuse answers a different first question. Where do your traces live? It's an open-source LLM engineering platform with a hosted cloud option and a self-hosted path, so teams with data-location requirements aren't forced into a vendor's storage on day one. It combines tracing with prompt management, datasets, evaluation, and token and cost tracking.
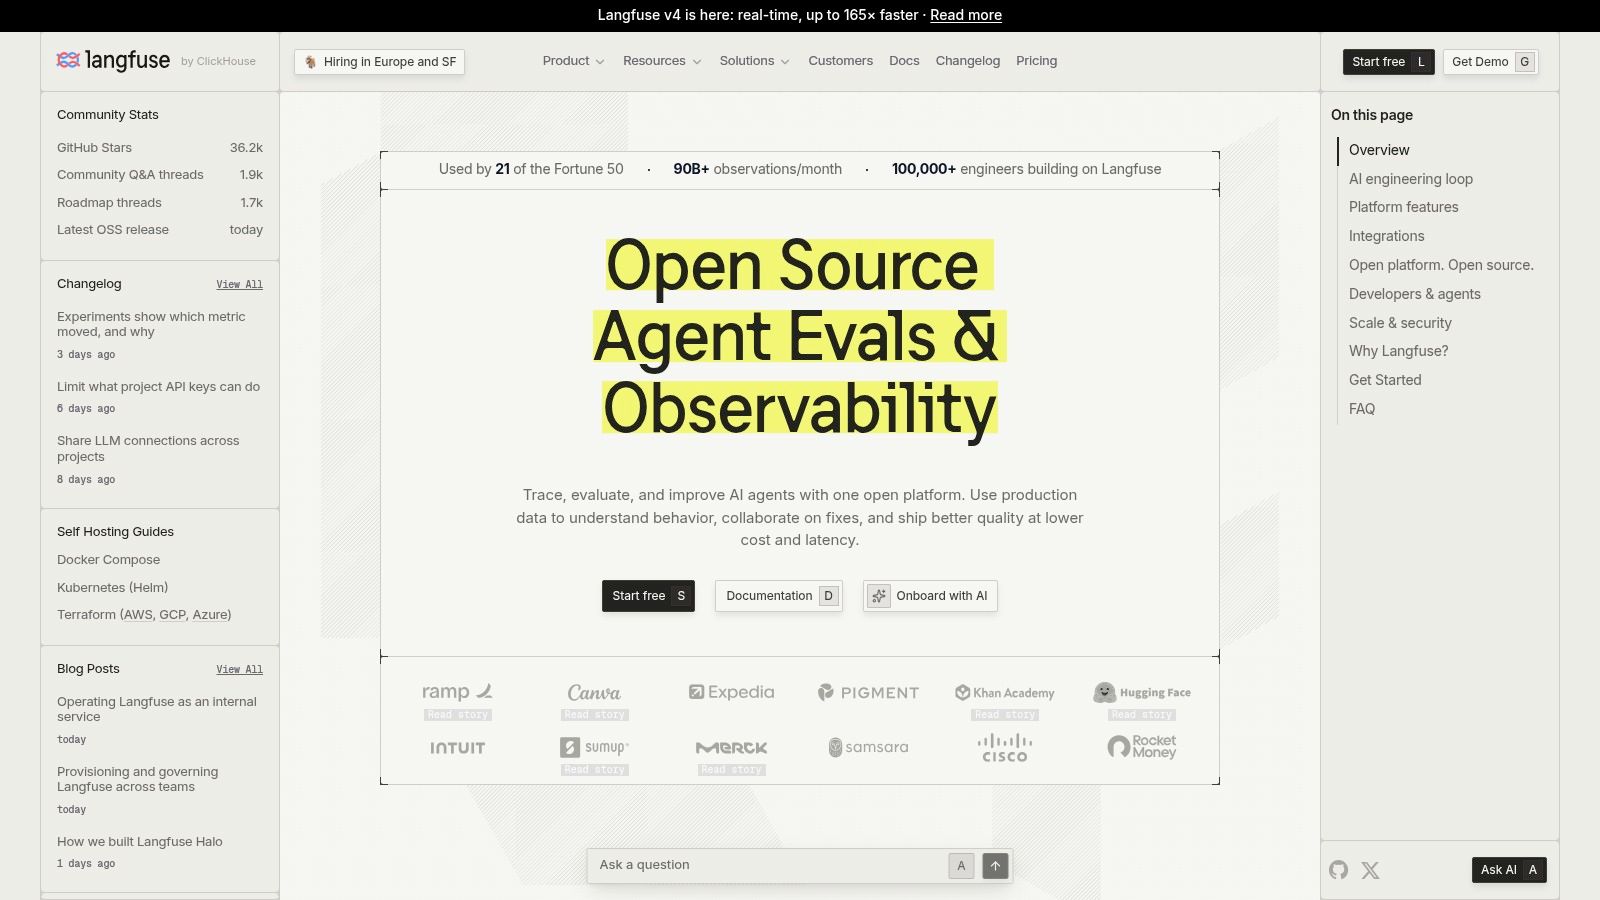
That breadth helps if prompts change often. You can version a prompt, run an experiment, and compare cost and quality without stitching three tools together. Instrumentation through common SDK patterns, including the clients described in Openbase's SDK documentation, keeps the integration familiar for application teams.
Deployment rule: Self-hosting gives you control over trace data, but you also own upgrades, scaling, backups, and uptime. Budget the operating work, not just the license.
Pricing needs attention before you commit. The Hobby plan is free with 50,000 units per month, Core starts at $29 per month, and Pro starts at $199 per month, with additional usage potentially applying. A unit isn't the same as a user request. One agent run can create a trace, several observations, and scores. Model a realistic run first, then check retention differences between cloud plans.
3. Arize Phoenix
If portability is your priority, start with Arize Phoenix. Phoenix is open source, local-first, and built on OpenTelemetry and OpenInference instrumentation. That standards-based approach reduces your dependence on one vendor's trace format and makes it easier to send telemetry to more than one backend later.
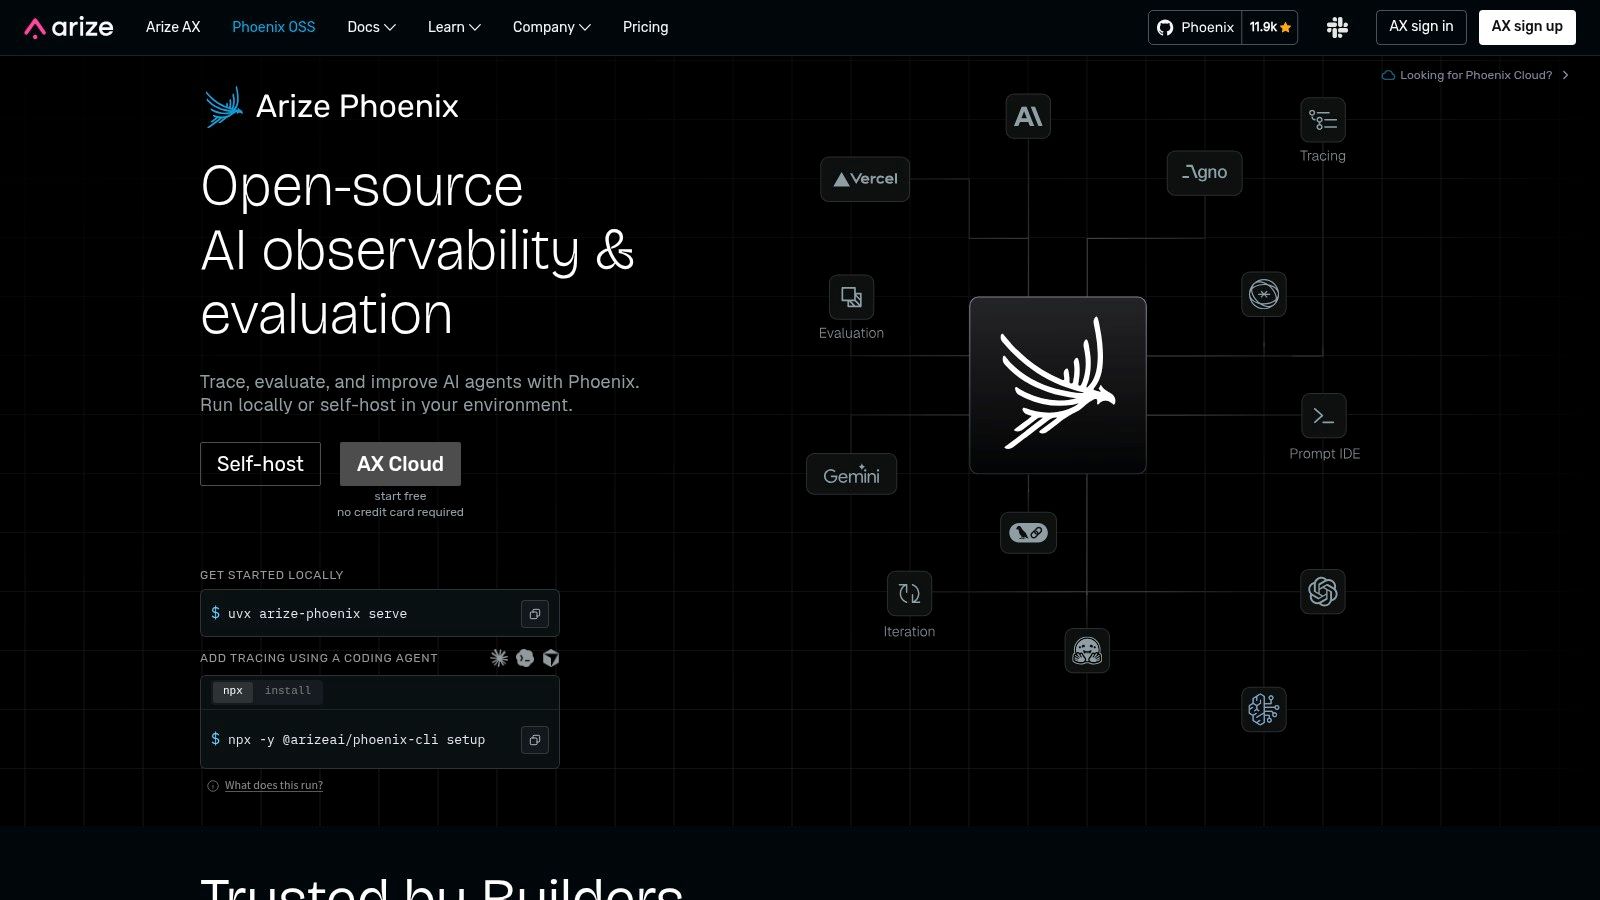
Phoenix covers tracing, evaluation, experimentation, and troubleshooting, and its prompt playground lets you compare models and prompts against captured data. You can run it locally during development and self-host it when data control matters. Arize AX is the separate managed platform for broader production workflows, and its pricing is separate from the open-source Phoenix project.
What to check before choosing it
- Instrumentation coverage: Confirm your framework emits the spans you expect for retrieval, tools, and model calls.
- Operations burden: Self-hosting means your team operates storage and upgrades.
- Product boundary: Don't assume every Phoenix workflow and every Arize AX workflow are identical. Confirm which product fits your production requirements.
Phoenix works well for engineering-led teams that want experimentation and tracing without surrendering the instrumentation layer. It's less convenient if you expect a fully managed monitoring operation with no additional services.
4. Helicone
Helicone takes the shortest path to visibility. Its proxy-based, OpenAI-compatible gateway can log requests with minimal application changes, which is useful when you need usage, cost, and latency dashboards this week rather than after a full SDK instrumentation project. SDK options and session tracing are also available, and the project is open source with self-hosting.
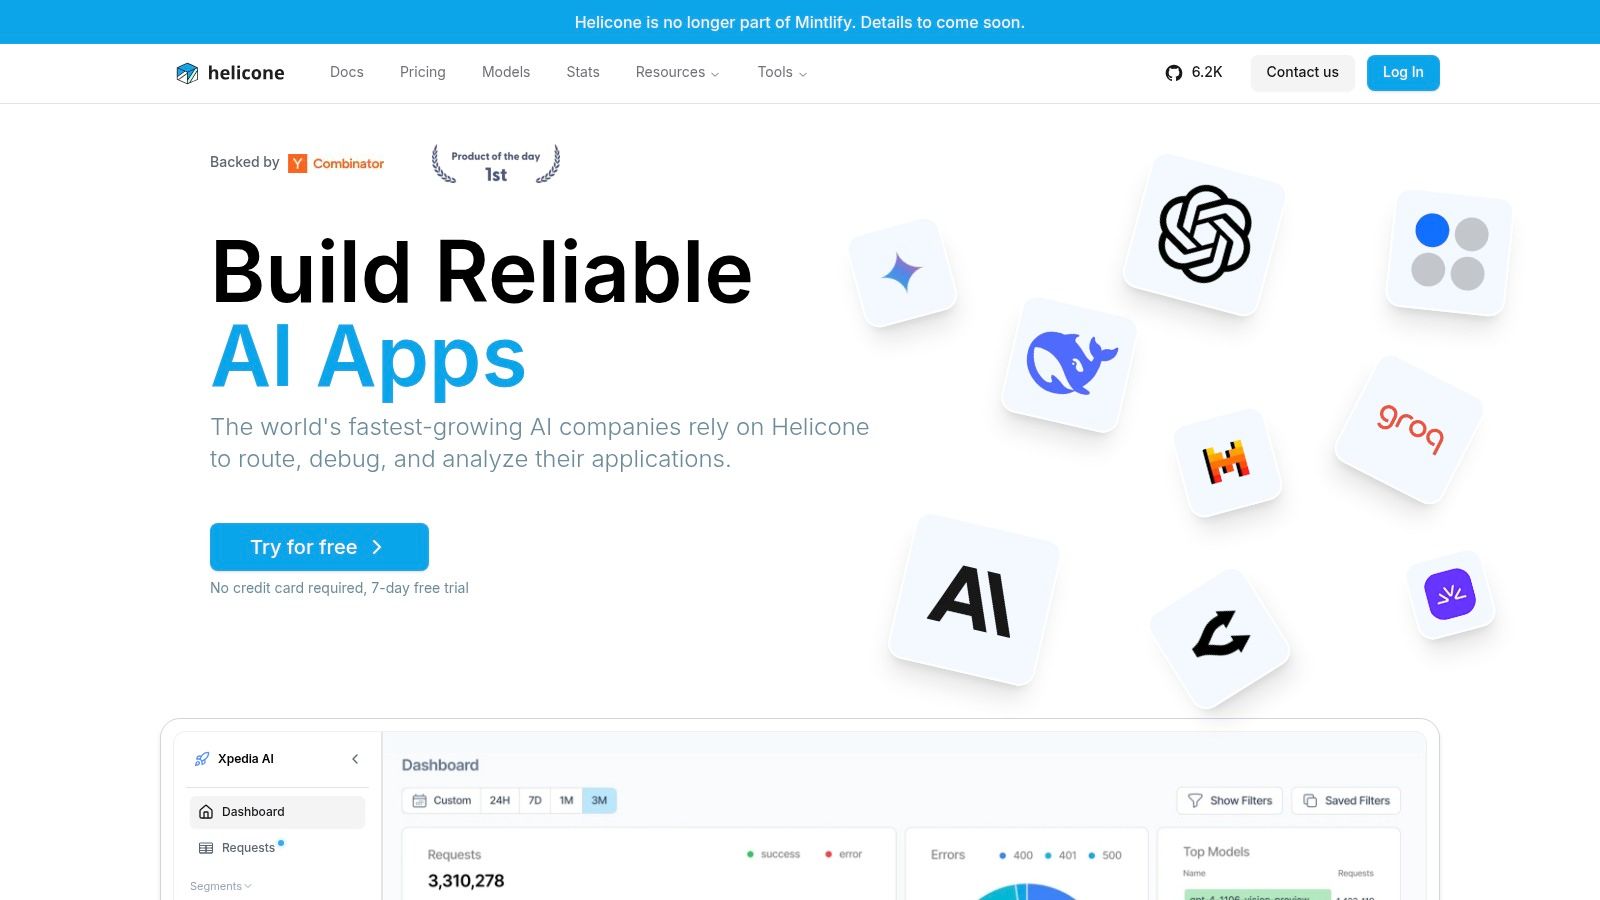
That speed comes with an architectural decision. A proxy sits in the request path, so you need to think about latency, failure behavior, and what happens during an outage. You also get less natural visibility into internal agent logic than deep SDK instrumentation provides. Request-level logs tell you what entered and left the model. They don't automatically explain every branch your application took between calls.
A proxy is a sensible starting point for cost and latency. It isn't a substitute for nested tracing when tools, retrieval, and handoffs determine the outcome.
Published material describes a free tier, but you should check the official site for current limits and paid plans. Also check for overlap if you already run a provider-routing layer. Two gateways in series can complicate retries, timeouts, and cost attribution without adding useful information.
5. Braintrust
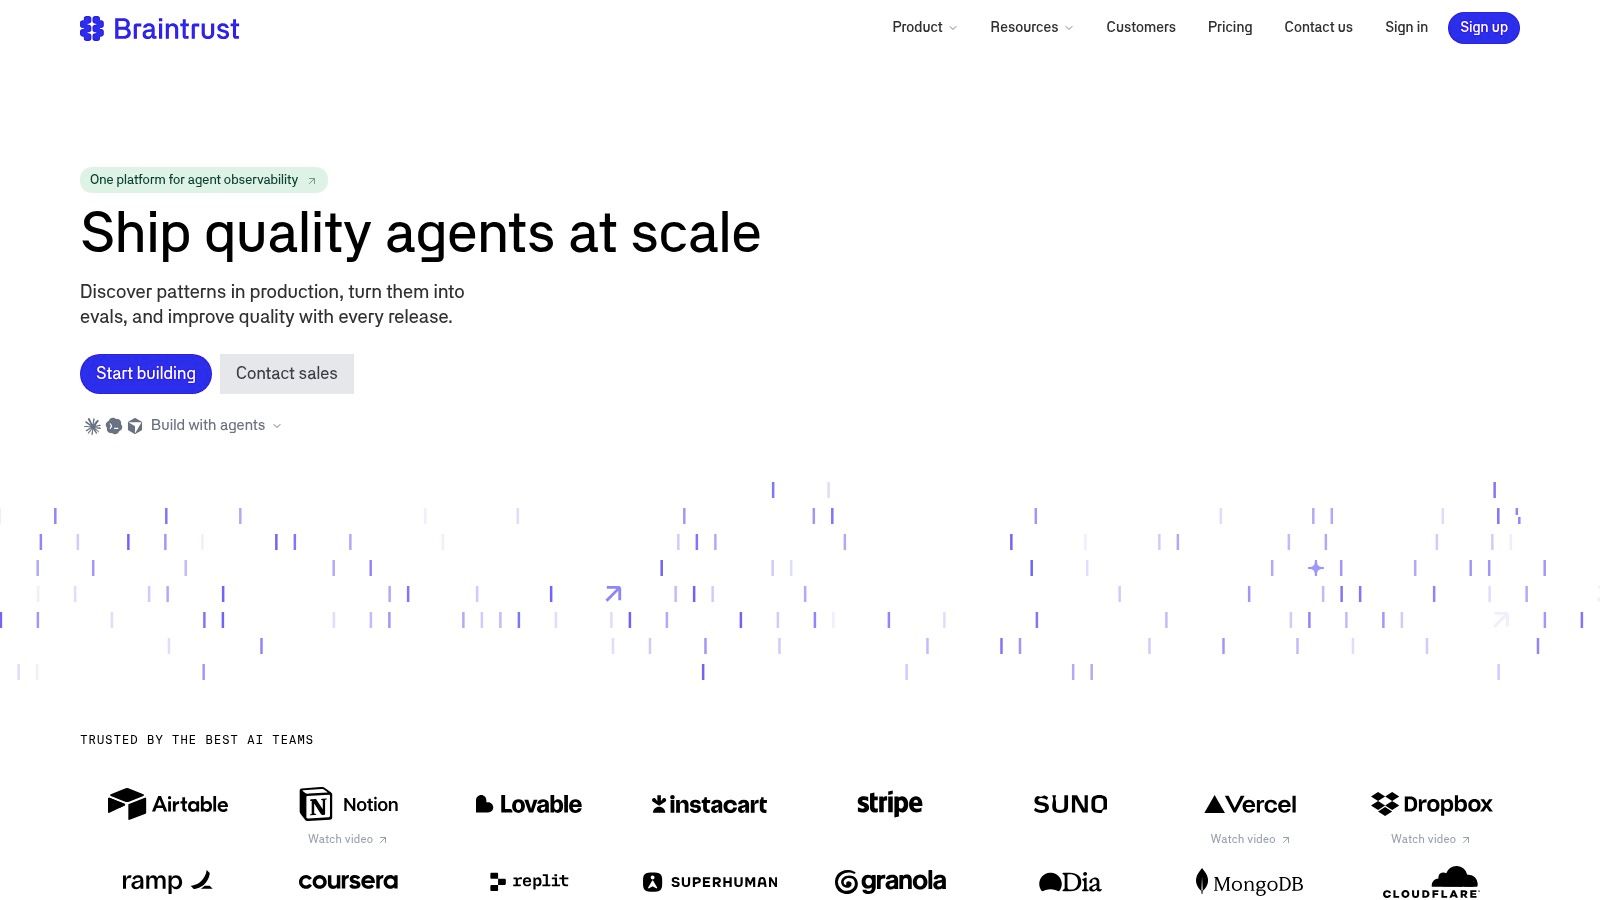
Braintrust is built for teams whose main risk is quality regression, not missing logs. It captures model calls, tool invocations, and retrieval steps as spans, scores live traffic with automated or human review, and turns production traces into evaluation datasets and regression tests. That production-to-test loop is the reason to pay for it.
How the workflow holds up
You can alert on quality changes, inspect the failing spans, and add those cases to a test suite. Integrations cover common providers and frameworks, plus OpenTelemetry. For streamed responses, pair trace data with the behavior described in Openbase's streaming documentation so time to first token and total latency aren't confused with each other.
- Strength: Production issues connect directly to regression testing.
- Flexibility: Human feedback and automated scoring can run side by side.
- Cost driver: Processed data and scoring volume, not just request count.
Starter is free with 1 GB of processed data and 10,000 scores per month. Pro is listed at $249 per month, and Enterprise pricing is custom. If you only need basic request logs, this is more workflow than you need. If silent quality drops are your expensive failure mode, it's a strong fit.
6. Datadog Agent Observability
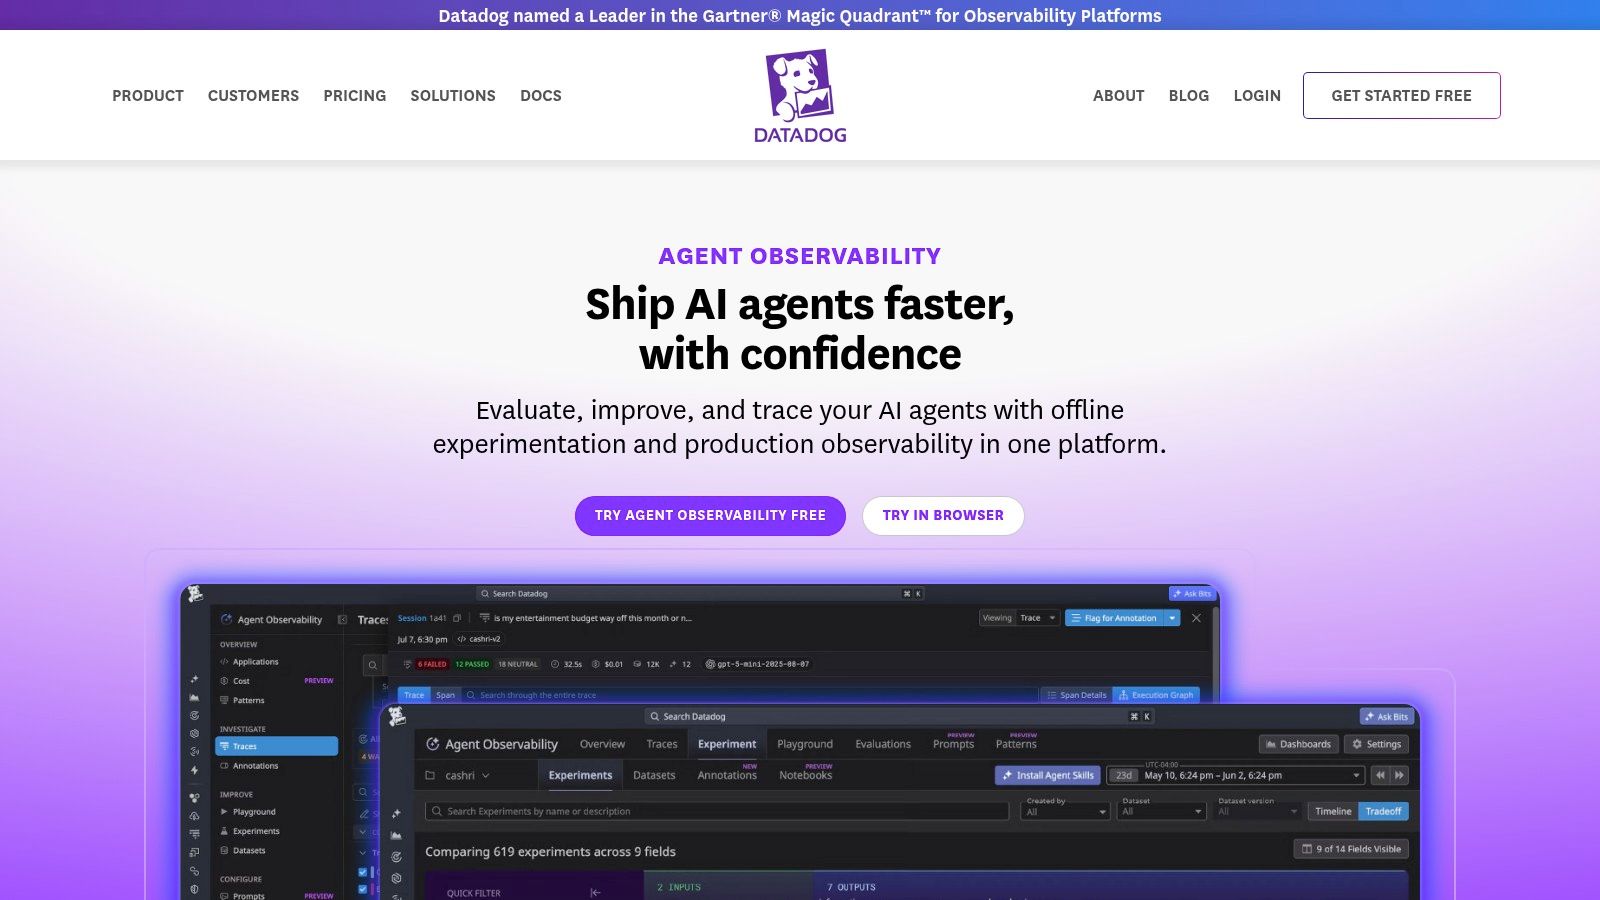
Choose Datadog Agent Observability when the question isn't only what the model did, but what the rest of your system was doing at the same time. It brings agent and LLM traces into Datadog's broader monitoring platform, so you can correlate model behavior with application and infrastructure telemetry instead of opening a second tool during an incident.
That correlation addresses a known weakness in conventional observability. In Elastic's 2024 Observability Landscape survey of 510 technology decision-makers, 99% said their observability data was siloed and only 16% could frequently correlate operational data with business impact. Datadog won't fix that automatically, but shared telemetry removes one boundary.
Features include cost and token analysis by application, model, or prompt, evaluations, datasets, experiments, and sensitive-data scanning. The free tier includes up to 40,000 LLM spans per month. Pro starts at $160 per month for 100,000 spans, with additional usage and retention priced separately. Usage is metered by LLM spans rather than every tool or workflow span, which helps, but span volume can still become a meaningful expense at scale. Cost views are only as accurate as your provider and token instrumentation.
7. LangWatch
LangWatch combines observability with evaluations, simulations, and testing, which suits teams that want to rehearse agent behavior before users encounter it. It supports nested agent traces and graphs, human review, and cost tracking by provider, prompt, and model. You can send data through SDKs, OpenTelemetry, or proxy integrations, and choose cloud or self-hosted deployment.
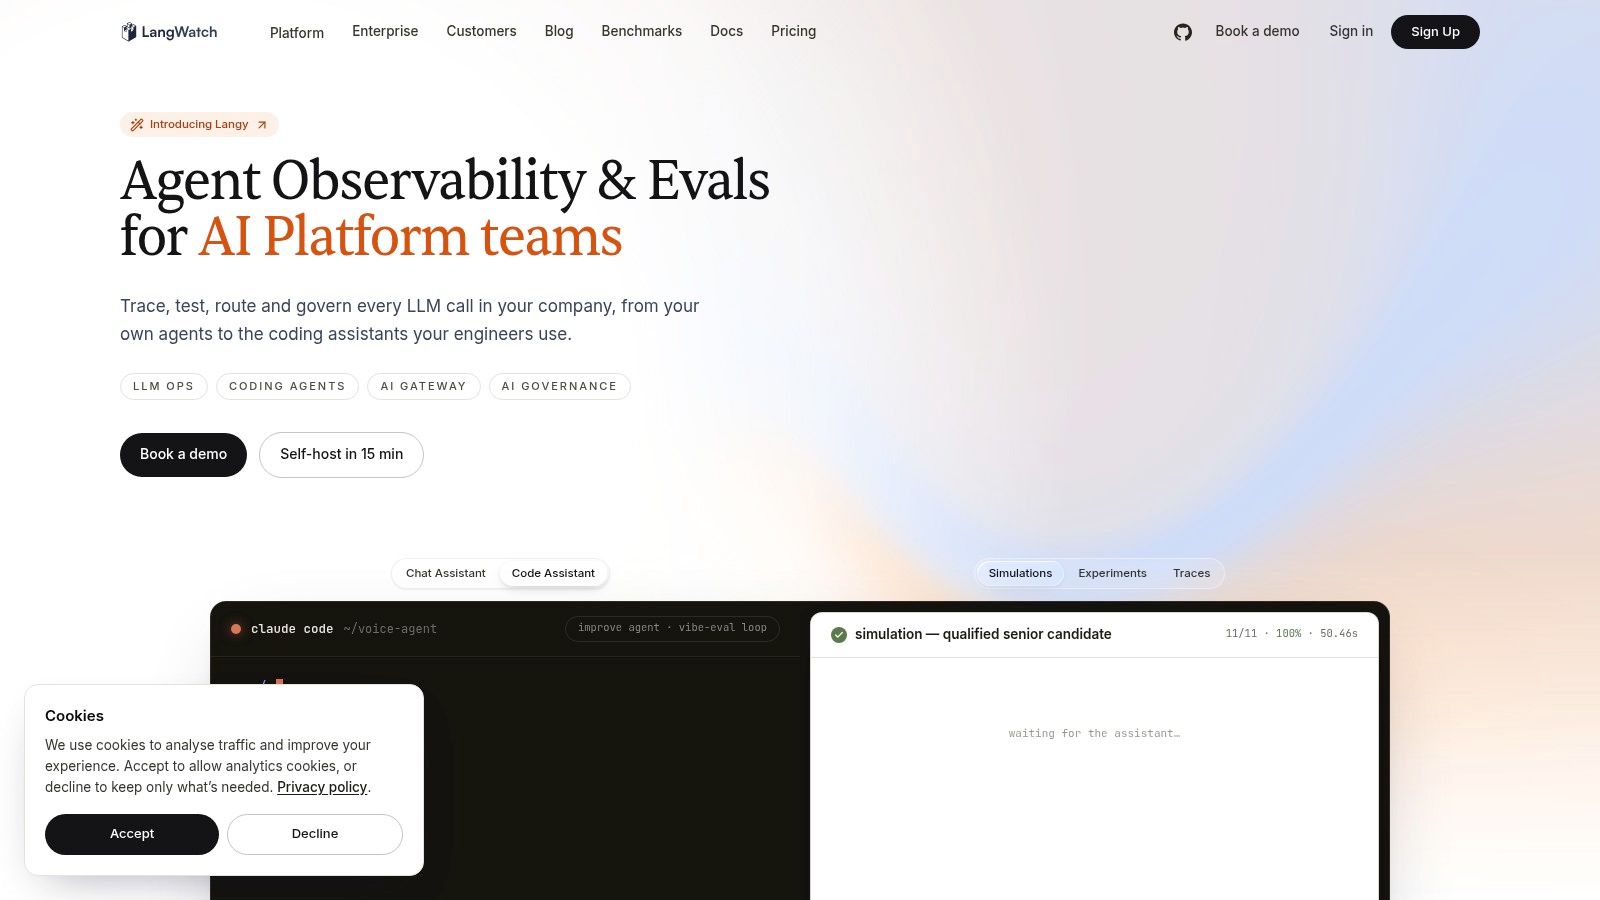
Simulation is the differentiator to test in a proof of concept. Don't evaluate it with a simple one-turn prompt. Use a workflow with retrieval, multiple tools, a retry, and a failure case, then check whether the trace graph still explains the sequence clearly. Also verify that a production failure can become a repeatable test without manual exports.
Pricing and setup trade-offs
The Developer plan is free with 50,000 events per month. Growth starts at €29 per core seat per month and includes 200,000 events, with additional usage charges possible. That mix of seats, events, and potentially storage needs careful modeling.
LangWatch offers more than basic logging, so expect more setup than a proxy-only tool. Review plan terms closely if you need self-hosting with enterprise controls. The breadth is useful when simulation is a real part of your release process, and wasteful when it isn't.
8. Opik
Opik is Comet's open-source platform for LLM and agent observability and evaluation. It provides agent traces and cost analysis, test suites with assertions, and an agent playground. Teams can self-host the open-source version or use the managed cloud, which gives you a migration path if operational priorities change.
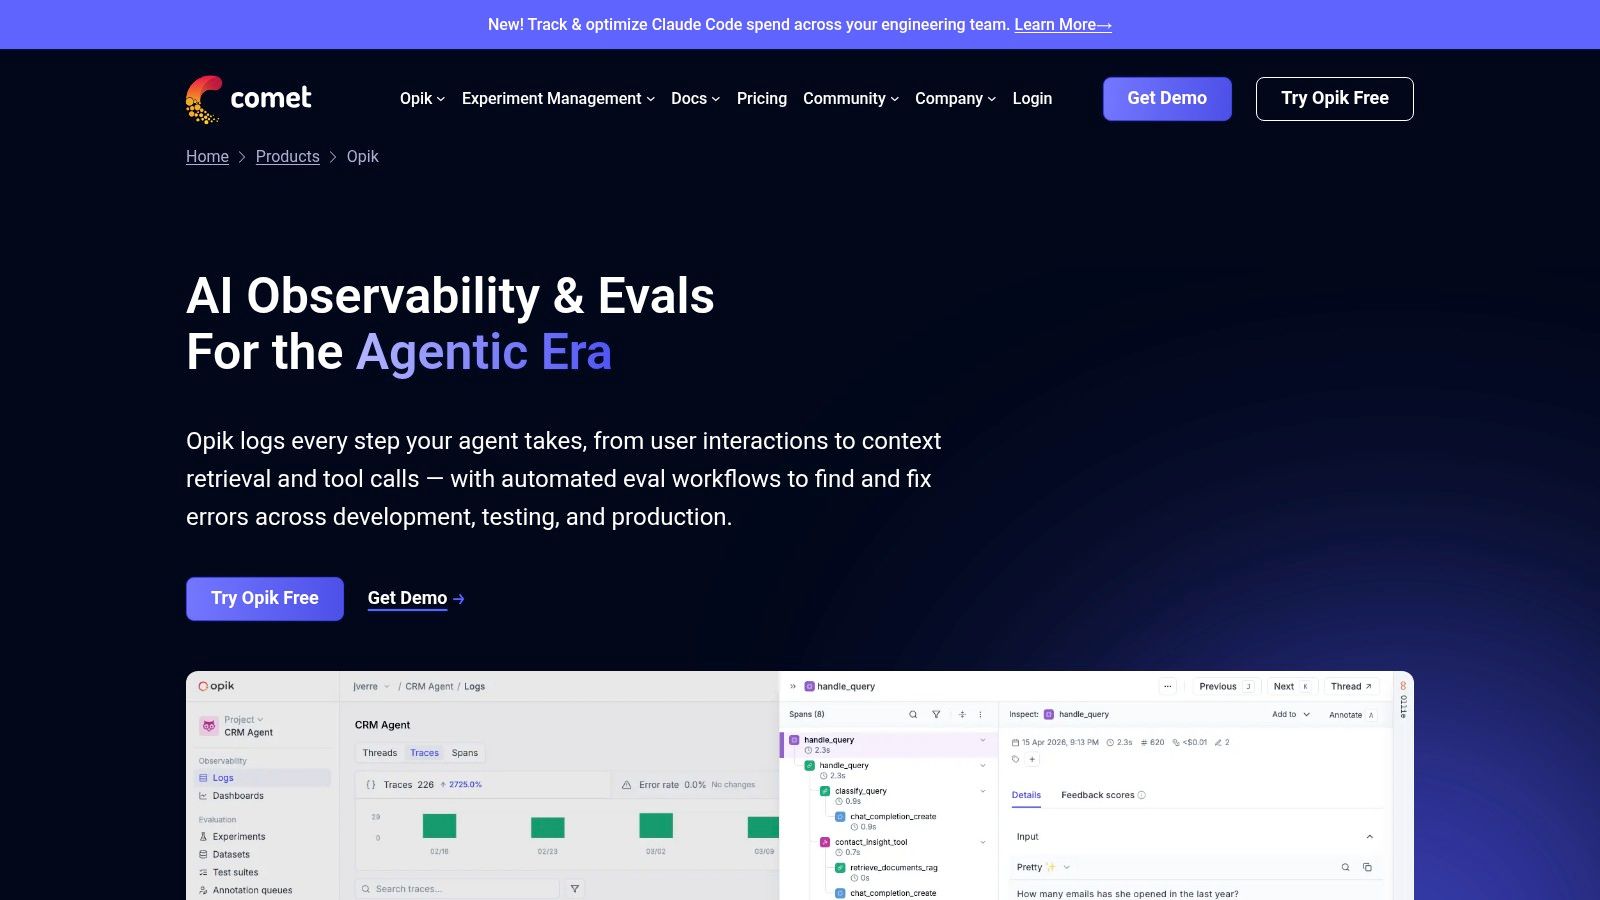
- Open-source route: Free to run yourself, with the usual responsibility for infrastructure and maintenance.
- Free Cloud: Includes 25,000 spans per month and 60-day retention.
- Pro Cloud: Costs $19 per month for up to 100,000 spans, with custom Enterprise pricing.
Opik fits teams that want tracing plus systematic testing, not logging alone. Assertions are particularly useful for deterministic checks, such as schema validity or whether a required tool was called. Semantic quality still needs evaluators or human labels, so don't treat passing assertions as proof that an answer was helpful.
Check two limits before rollout. Span allowances and retention vary by plan, and estimated costs may be unavailable for unsupported models. Validate provider and framework support against your actual stack, especially if you use newer models or custom tool runtimes.
9. Portkey
Portkey is first an AI gateway and second an observability layer. That ordering matters. Its value is centralizing routing, fallbacks, load balancing, retries, prompt management, and guardrails, while its logs and traces can be filtered by metadata. Hosted and self-hosted deployment options are available.
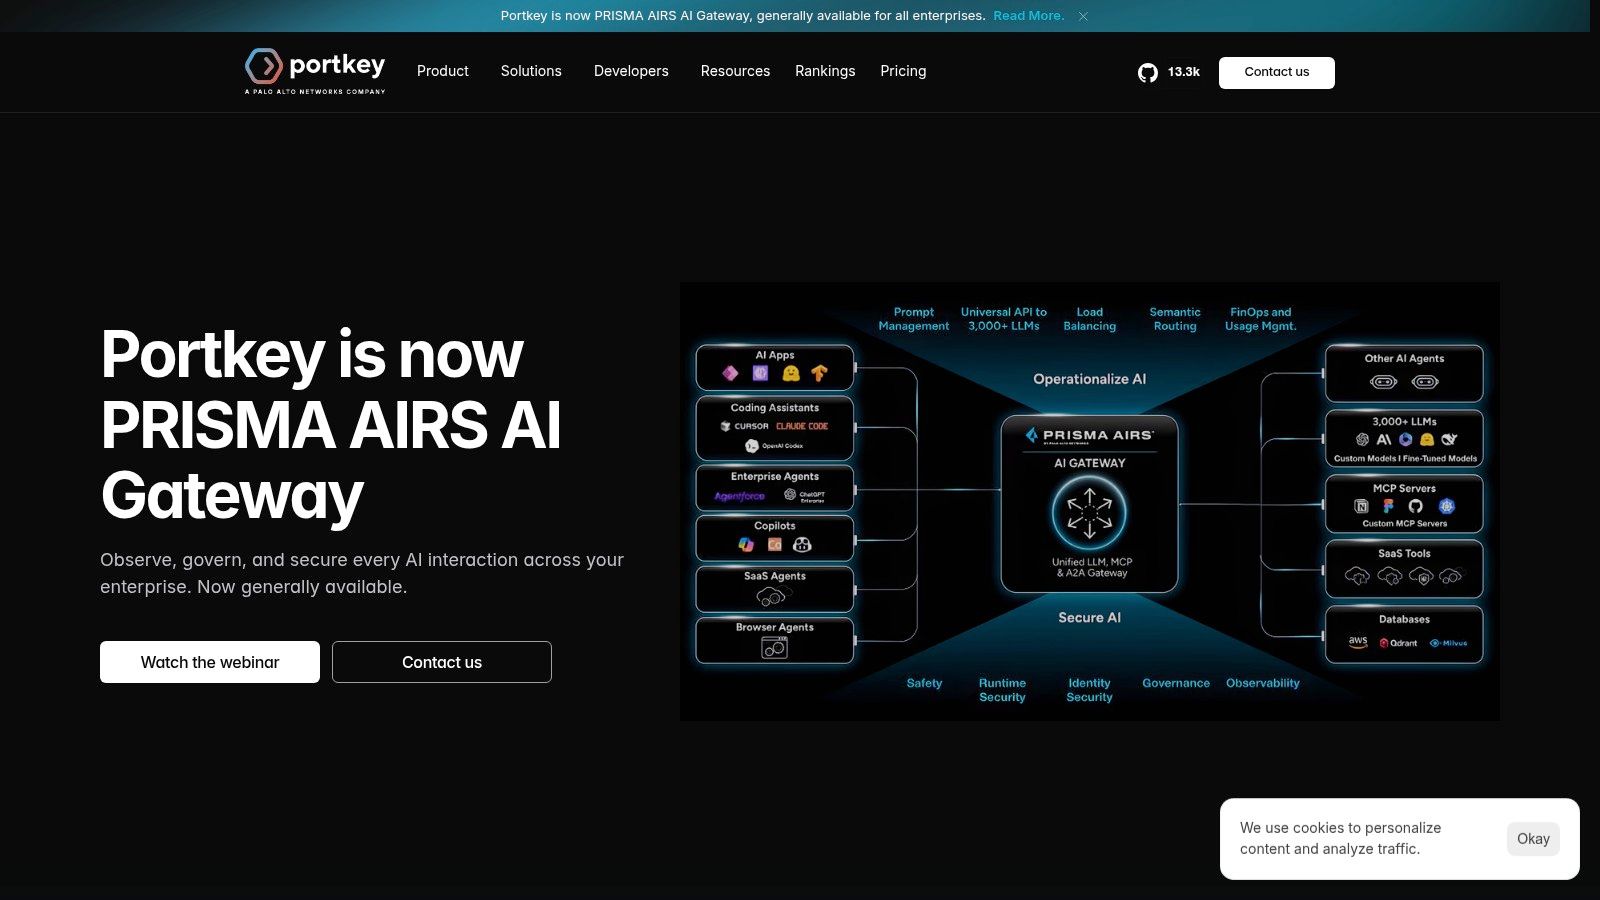
This makes sense when provider reliability is part of the problem. If a model appears to degrade, gateway-level data can help you separate output quality from throttling, timeouts, retry frequency, and routing instability. Request logs, traces, filters, and alerts give operations teams a usable view across providers.
Gateway check: Test what happens when the gateway itself is slow or unavailable. Failover logic doesn't help if the control point becomes the failure.
The Free plan includes 10,000 recorded logs per month, and Production is $49 per month for 100,000 recorded logs, with overage charges. The free plan is explicitly not intended for production workloads. Production includes longer log retention and alerts, while custom security or data-residency requirements may require Enterprise. If you already have a gateway, check for duplicated routing, prompt, and guardrail features before adding another layer.
10. Galileo
Galileo prioritizes output quality, evaluation, and guardrails over general-purpose telemetry. Its positioning emphasizes carrying offline evaluations into production monitoring, so the same concerns you test before release can be watched on live traffic. Features include LLM tracing, production monitoring, custom evaluators, and enterprise deployment options.
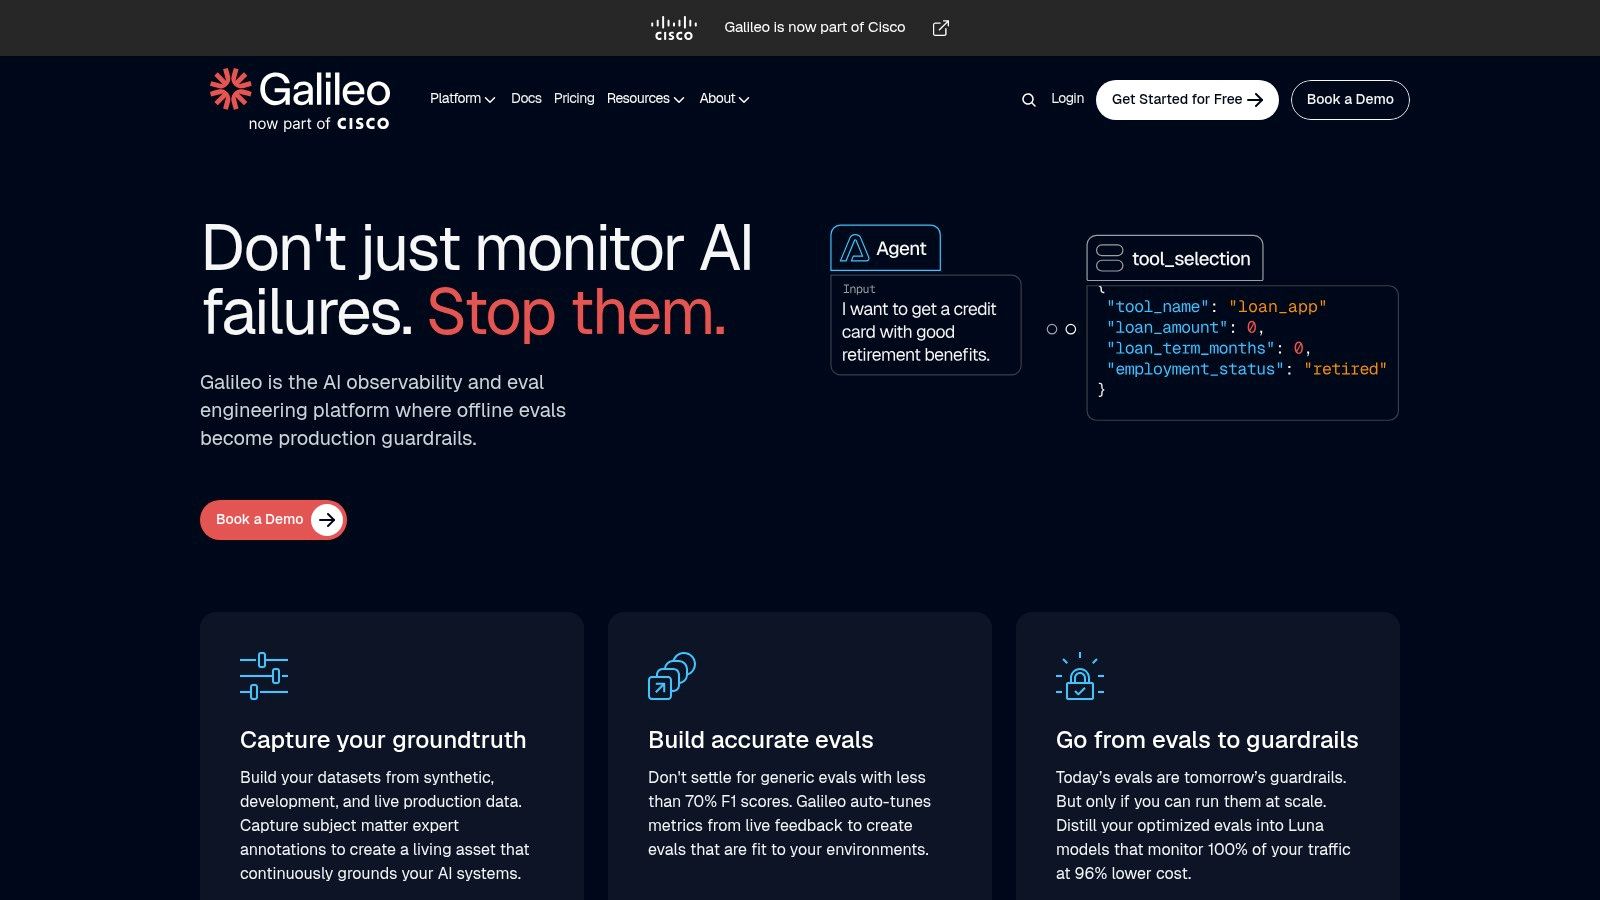
That focus suits teams where a successful HTTP response can still be a harmful product failure. Tracing cost and latency won't tell you whether an answer was unsafe, unsupported, or wrong for the user's task. Custom evaluators help, but they still need validation against examples from your own domain. A generic score shouldn't become a release gate until you've compared it with human judgments on real cases.
Plans and constraints
The Free plan includes 5,000 traces per month. Pro is listed at $100 per month for 50,000 traces, with volume scaling, and Enterprise pricing is custom. Pro adds advanced analytics and support, while Enterprise includes hosted, VPC, or on-prem deployment options.
Galileo is a reasonable shortlist entry when quality and safety checks are central. Teams that specifically want open-source or self-hosted tooling should confirm availability and requirements rather than assuming the enterprise deployment options match that need.
AI Observability Tools: Top 10 Comparison Matrix
| Platform | Core Capabilities & Standout | Best For | Pricing Snapshot | Key Trade-off |
|---|---|---|---|---|
| LangSmith | Tracing, evaluations, experiments, and retention options ✨ | 👥 Teams debugging agent workflows and improving quality | 💰 Free up to 5,000 traces/month; Plus from $39/seat/month | Usage charges may add to seat costs |
| Langfuse | Open-source tracing, cost tracking, prompts, and evaluations ✨ | 👥 Teams wanting self-hosting and control over data | 💰 Free Hobby; Core from $29/month; Pro from $199/month | Self-hosting requires maintenance |
| Arize Phoenix | OpenTelemetry tracing, evaluations, datasets, and prompt playground ✨ | 👥 Teams favoring open-source, local-first workflows | 💰 Phoenix is open source; Arize AX priced separately | Broader production monitoring may need other tools |
| Helicone | OpenAI-compatible gateway, request logs, cost and latency dashboards ✨ | 👥 Teams seeking gateway features and quick observability | 💰 Free tier; confirm current paid-plan details | Proxy adds a component to the request path |
| Braintrust | Tracing, live scoring, alerts, and trace-to-test workflows ✨ | 👥 Teams connecting production quality issues to regression tests | 💰 Free tier; Pro listed at $249/month | Processed data and scoring can increase costs |
| Datadog Agent Observability | LLM traces, cost analysis, evaluations, and broader telemetry ✨ | 👥 Organizations already using Datadog | 💰 Free up to 40,000 spans/month; Pro from $160/month | Span usage and retention may raise spend |
| LangWatch | Agent traces, cost tracking, evaluations, simulations, and human review ✨ | 👥 Teams testing and monitoring complex agent workflows | 💰 Free up to 50,000 events/month; Growth from €29/core seat/month | Pricing can combine seats, events, and storage |
| Opik | Open-source tracing, cost analysis, test suites, and agent playground ✨ | 👥 Teams seeking flexible self-hosted or managed options | 💰 Open source free; Cloud free up to 25,000 spans/month; Pro from $19/month | Span limits and retention vary by plan |
| Portkey | Gateway, routing, retries, fallbacks, logs, and prompt tools ✨ | 👥 Teams wanting observability and model routing together | 💰 Free up to 10,000 logs/month; Production $49/month | Some gateway features may duplicate existing tools |
| Galileo | Quality evaluations, production monitoring, custom evaluators, and guardrails ✨ | 👥 Teams prioritizing output quality and safety | 💰 Free up to 5,000 traces/month; Pro from $100/month | Pro cost scales with trace volume |
Choose a Monitoring Stack That Scales With Your Stack
Start with the operational gap, not the feature count. If you can't answer what a request cost, which provider served it, and where latency accumulated, a lightweight proxy or gateway may be enough. Helicone and Portkey fit that starting point, with the caveat that anything in the request path needs failure testing. If you already have request logs but can't explain multi-step agent behavior, move to nested tracing through LangSmith, Langfuse, Phoenix, LangWatch, or Opik.
Choose portability early if changing backends would be painful. OpenTelemetry-based instrumentation, especially through Phoenix and other standards-aware tools, keeps your spans usable if pricing, retention, or deployment requirements change. Self-hosting follows the same logic. Langfuse, Phoenix, Opik, and Helicone give you more control over where trace data lives, but control isn't free. Your team owns upgrades, storage growth, access control, and availability.
Pick evaluation-first tooling when quality is the main production risk. Braintrust and Galileo are built around that problem, while LangSmith, Langfuse, LangWatch, and Opik also connect traces to datasets and tests. Many teams are still immature here. A 2025 Gartner survey summarized in the Market Guide for AI found only 18% of respondents used AI evaluation tools for testing custom-built agents, and Gartner estimated market penetration below 25% of the potential target audience. Basic logging won't close that gap.
Be careful with automated diagnosis, whichever platform you choose. In S&P Global Market Intelligence's 2025 survey reported by 451 Alliance, 71% of observability users had adopted AI features, but 32% cited incorrect analysis and 22% cited incorrect alert suppression as concerns. Treat AI explanations as decision support. Keep raw traces, expose the evidence behind an alert, and require human approval before a system suppresses alerts or triggers remediation.
Also decide how you'll connect telemetry to accountability. Traces can show latency, tokens, tool calls, and retries, but they don't by themselves prove whether a failure came from the model, the workflow, permissions, or human review. Add fields for release version, prompt version, affected workflow, severity, and user-visible outcome. That context turns an archive of symptoms into something your team can learn from during incident review.
For teams routing requests through multiple model providers, gateway-level logging can complement a specialist AI observability tool. Openbase provides unified API access with automatic failover and per-call usage logging for model, provider, input and output tokens, latency, time to first token, and exact cost. That doesn't replace nested agent tracing or evaluation. It does give you a consistent provider and cost baseline underneath whichever observability platform you choose.
Run finalists against the same representative workload before you buy. Include retrieval, at least two tools, one retry, streaming, and a known bad output. Then verify that an engineer can find the failure, explain it, turn it into a test, and estimate the monthly bill from the vendor's actual metering unit. If a tool can't do that in the proof of concept, a longer feature list won't save it in production.
Openbase gives your team one OpenAI-compatible API for models from multiple providers, with automatic failover and per-call logs for model, provider, tokens, latency, time to first token, and exact cost. Pair that gateway visibility with the AI observability tool that best fits your tracing and evaluation needs, and visit Openbase to consolidate model access, billing, and request-level usage data.