
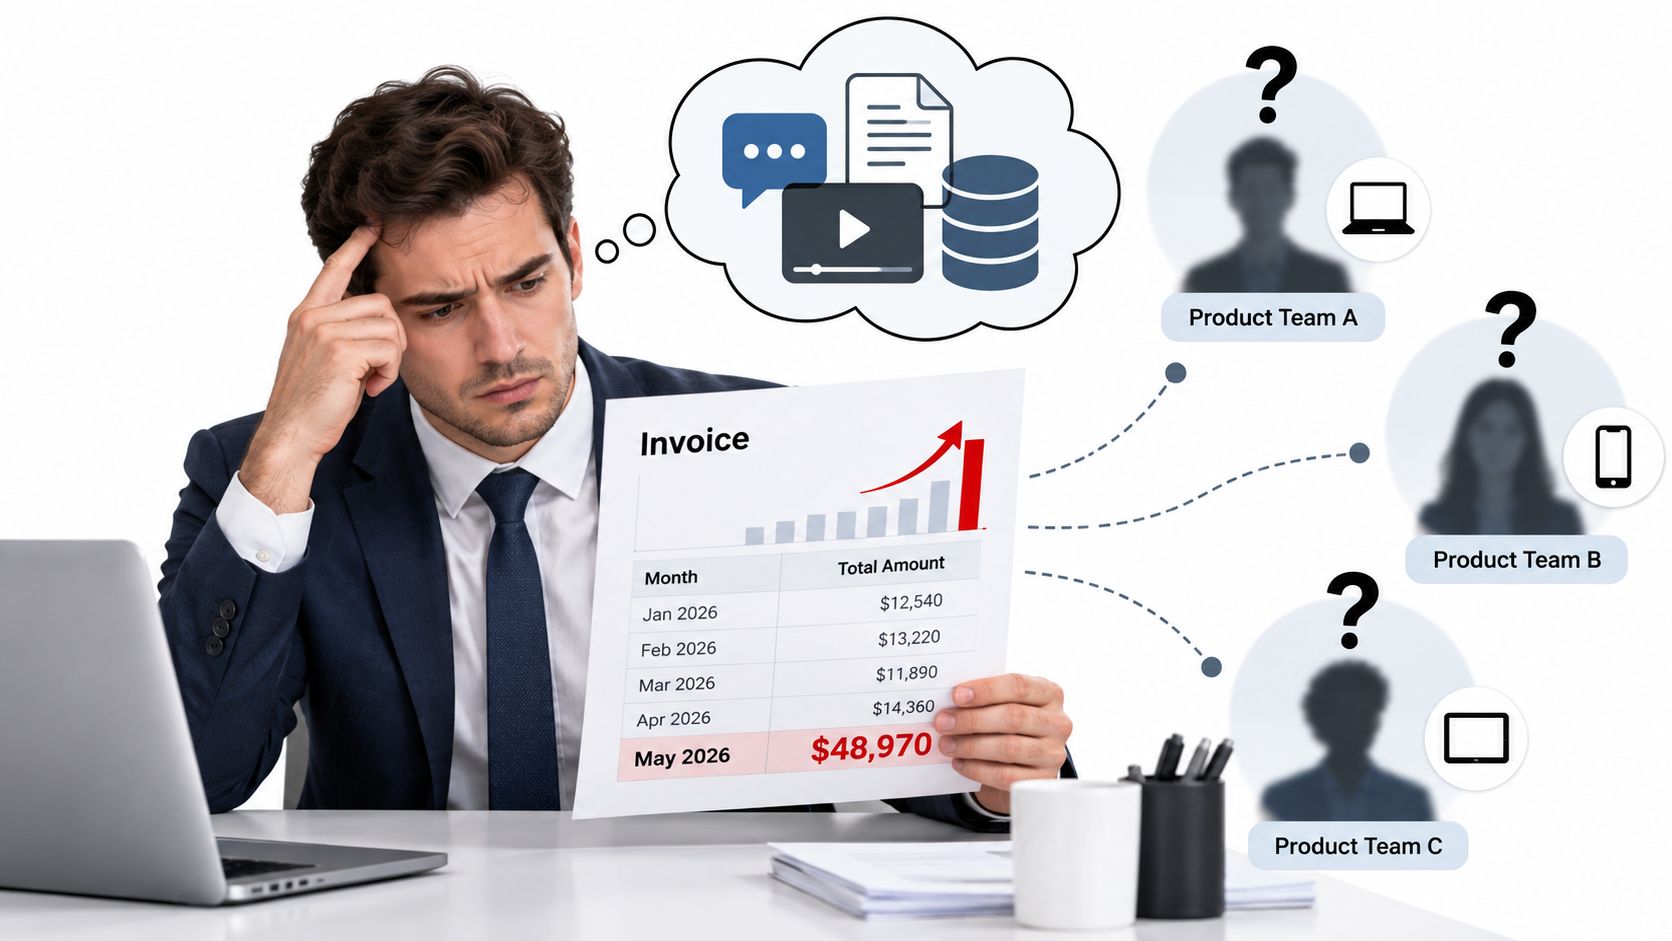
The invoice arrives, and the total is higher than finance expected. Engineering points to increased product usage. Product points to a new assistant feature. Each model provider shows a different slice of the activity, with different naming, billing periods, retry behavior, and export formats. Nobody can answer the basic question quickly: which team, feature, customer, or workflow created the spend, and did that spend produce a useful result?
An API usage dashboard should settle that argument with evidence. Request volume matters, but it's only the starting point. Finance needs attribution, operations needs failure and latency context, and product leaders need unit economics that connect AI consumption to successful work.
Table of Contents
- The Blind Spot Behind a Growing AI Bill
- What an API Usage Dashboard Actually Is
- The Core Metrics Every Dashboard Must Show
- Latency, TTFT, and Why Averages Lie
- From Raw Spend to Cost Attribution and Unit Economics
- How a Unified Multi-Provider Gateway Changes the View
- A Practical Checklist for Finance and Ops Teams
The Blind Spot Behind a Growing AI Bill
The finance lead opens the monthly invoice during a review meeting. The number is up, but the invoice doesn't identify an owner. One provider shows token consumption, another emphasizes requests, and a third separates charges by model family in a way that doesn't match the company's internal project names.
The platform engineer checks gateway logs and finds retries. The product manager says a new customer-facing workflow launched recently. A support lead says the team has been testing a summarization feature. Everyone has a plausible explanation, but nobody has a defensible allocation.
That's the difference between usage visibility and decision visibility. A provider portal may tell you how much was consumed. It usually doesn't tell you whether the cost came from production or development, which release introduced the change, whether a failed attempt was retried through another provider, or whether the resulting task succeeded.
The missing join between systems
Separate dashboards force finance to reconcile one set of names with engineering's keys, product's feature labels, and the gateway's request records. That process creates spreadsheets, manual assumptions, and arguments about whether retries belong to the original team or the infrastructure budget.
A unified dashboard changes the meeting. Finance can filter spend by owner, environment, feature, customer, model, and provider. Operations can see that a cost increase came from failover retries rather than organic demand. Product can compare the cost per successful task across models instead of treating every request as equally valuable.
The broader shift makes this problem harder to ignore. A 2023 developer-industry survey reported that 91% of developers build or work with APIs daily, while 72% of enterprises identified APIs as their primary integration method, up from 62% in 2021 (API industry statistics). As APIs become core infrastructure, usage reporting becomes a platform and finance concern, not just a developer convenience.
Practical rule: If the dashboard can't answer who spent what, on which workflow, under which provider, and with what result, it isn't a finance-ready usage dashboard.
What an API Usage Dashboard Actually Is
An API usage dashboard is a structured telemetry and cost layer built around individual requests. It records each call as an event, preserves the dimensions needed for investigation, and aggregates those events into views that match real operating decisions.
That definition separates it from three weaker tools. A request-count widget shows volume without meaning. A generic observability dashboard may show service health without precise billing context. A provider invoice shows charges without your internal ownership model. A serious dashboard joins these perspectives.
Start with the request event
Every request should retain enough information to reconstruct what happened. The minimum useful record includes:
- Identity: Request ID, API key, environment, team, feature, tenant, and endpoint.
- Model context: Provider, model, model family, region, routing decision, and fallback path.
- Consumption: Input tokens, output tokens, reasoning tokens where available, and payload volume when relevant.
- Timing: Time to first token, total duration, queue time, upstream duration, and retry timing.
- Outcome: Status class, error type, timeout state, usable or unusable output, and retry count.
- Financial record: Exact billed cost, allocation owner, currency, and billing state.
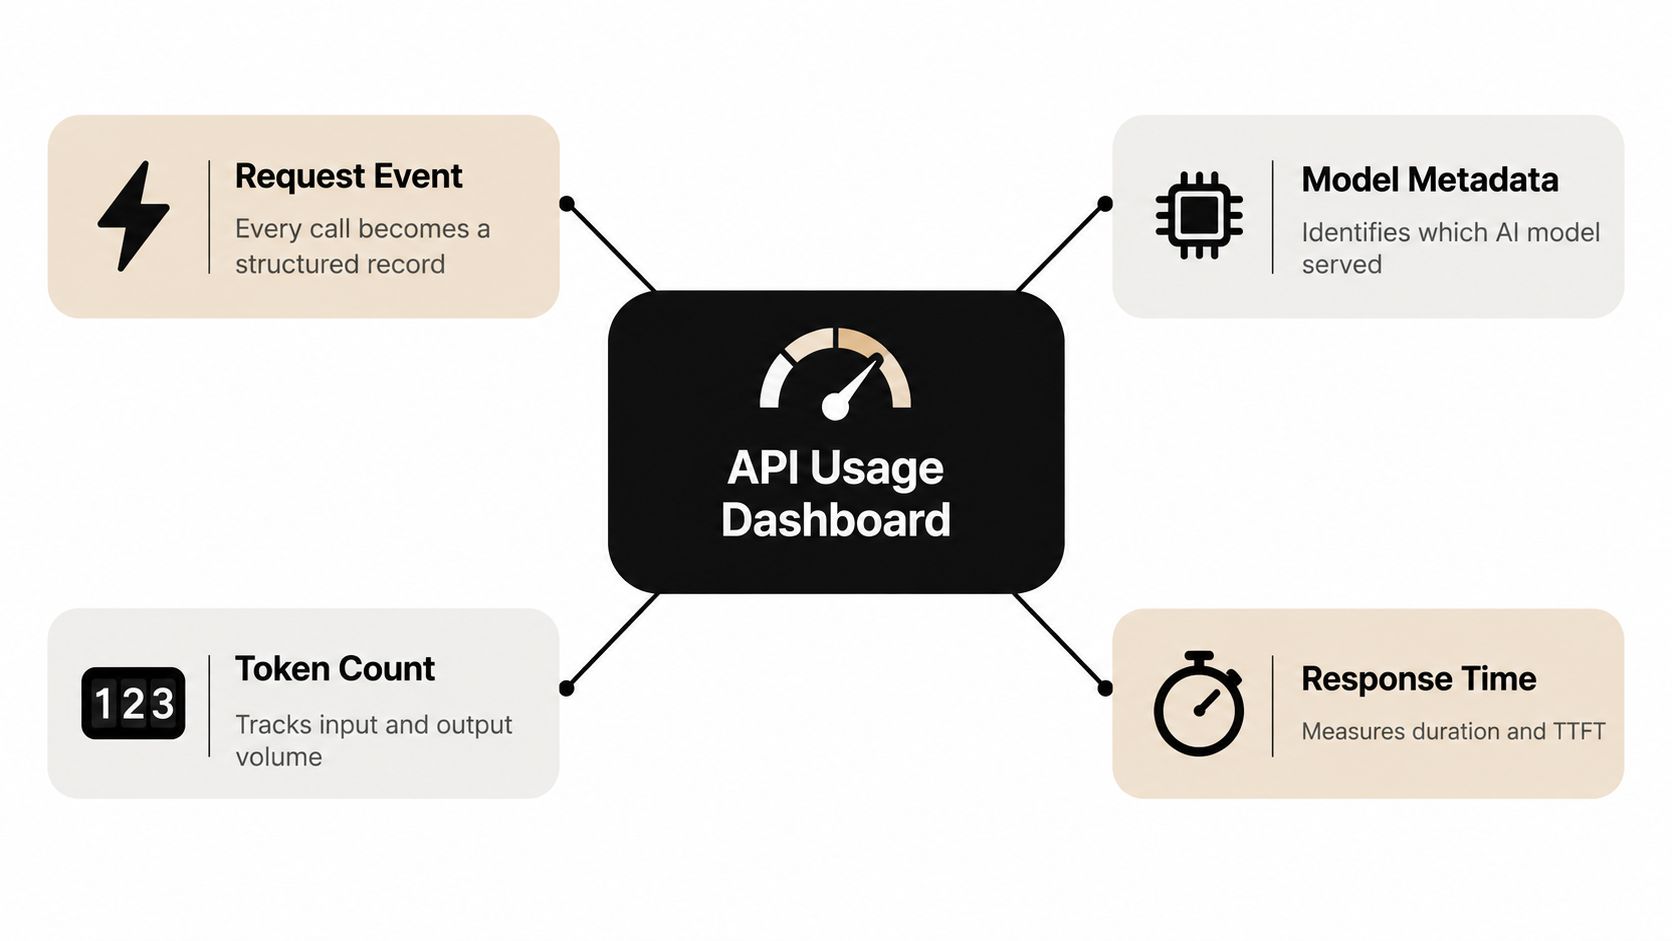
The event is the source of truth. Daily totals and monthly charts are rollups, not replacements for the underlying record. Without request-level data, the dashboard can't explain an anomaly or support a disputed charge.
Build views around decisions
Finance wants actual spend against budget, ownership, forecasts, and chargeback. Operations wants traffic, errors, latency, saturation, and provider health. Product wants adoption, task success, cost per workflow, and quality signals. The same event stream should serve all three audiences through controlled views.
Observability practice supports this combined model. A CNCF observability microsurvey reported that Prometheus was used by 86% of respondents for event monitoring and alerting, while OpenTelemetry was used by 49% for instrumenting, collecting, and exporting performance data. The useful lesson isn't to copy a tool choice. It's to store structured telemetry that can support both immediate alerts and historical comparisons.
A dashboard that only counts calls is a log viewer with nicer colors. A dashboard that connects calls to owners, outcomes, latency, and exact cost becomes an operating system for AI consumption.
The Core Metrics Every Dashboard Must Show
The first mistake teams make is collecting every available field without deciding what each field should control. The right question is simpler: what decision becomes possible when this metric is accurate?
| Metric | What it measures | Decision it supports | Common mistake |
|---|---|---|---|
| Input tokens | Prompt and context volume sent upstream | Prompt budgeting, context reduction, and cost allocation | Reporting only daily totals |
| Output tokens | Generated response volume | Model selection, response-length controls, and unit economics | Treating output as equivalent across models |
| Reasoning tokens | Hidden or separately billed reasoning consumption where available | Accurate billing, model comparison, and routing | Folding them into an unexplained total |
| Provider and model | Which upstream served the request | Failover analysis, routing, and performance comparison | Showing only the abstract model name |
| Latency | Total request duration | Service-level review and incident diagnosis | Using averages alone |
| Time to first token | Delay before streamed output begins | Perceived responsiveness and streaming quality | Hiding it inside completion time |
| Exact cost per call | Billed cost for the request | Chargeback, forecasting, and cost per task | Reconstructing cost from rough monthly rates |
Tokens are the economic raw material
Input and output tokens explain why two requests that look identical at the application level can have different costs. A dashboard should preserve both values, not just the combined total, because long context and long generation create different optimization opportunities.
Reasoning tokens deserve separate treatment when the upstream exposes them. If they're hidden inside output totals, finance can't reconcile the bill and engineering can't compare models.
Provider and model explain tradeoffs
A model label without the provider is incomplete in a multi-provider environment. The same model family may have different availability, latency, rate limits, and billing behavior depending on the upstream route. Store both values and make them filterable.
Timing must describe the user experience
Total latency tells you how long the request took. Time to first token tells you when the user saw progress. For streaming interfaces, that distinction is operationally important. A request can complete within an acceptable window while still feeling broken because the first token arrives too late.
Cost per call connects engineering to finance
Exact per-call cost is the bridge between usage telemetry and financial control. It supports cost per successful request, cost per customer workflow, and cost per feature release. A monthly total can identify a problem. Per-call attribution can assign it.
Latency, TTFT, and Why Averages Lie
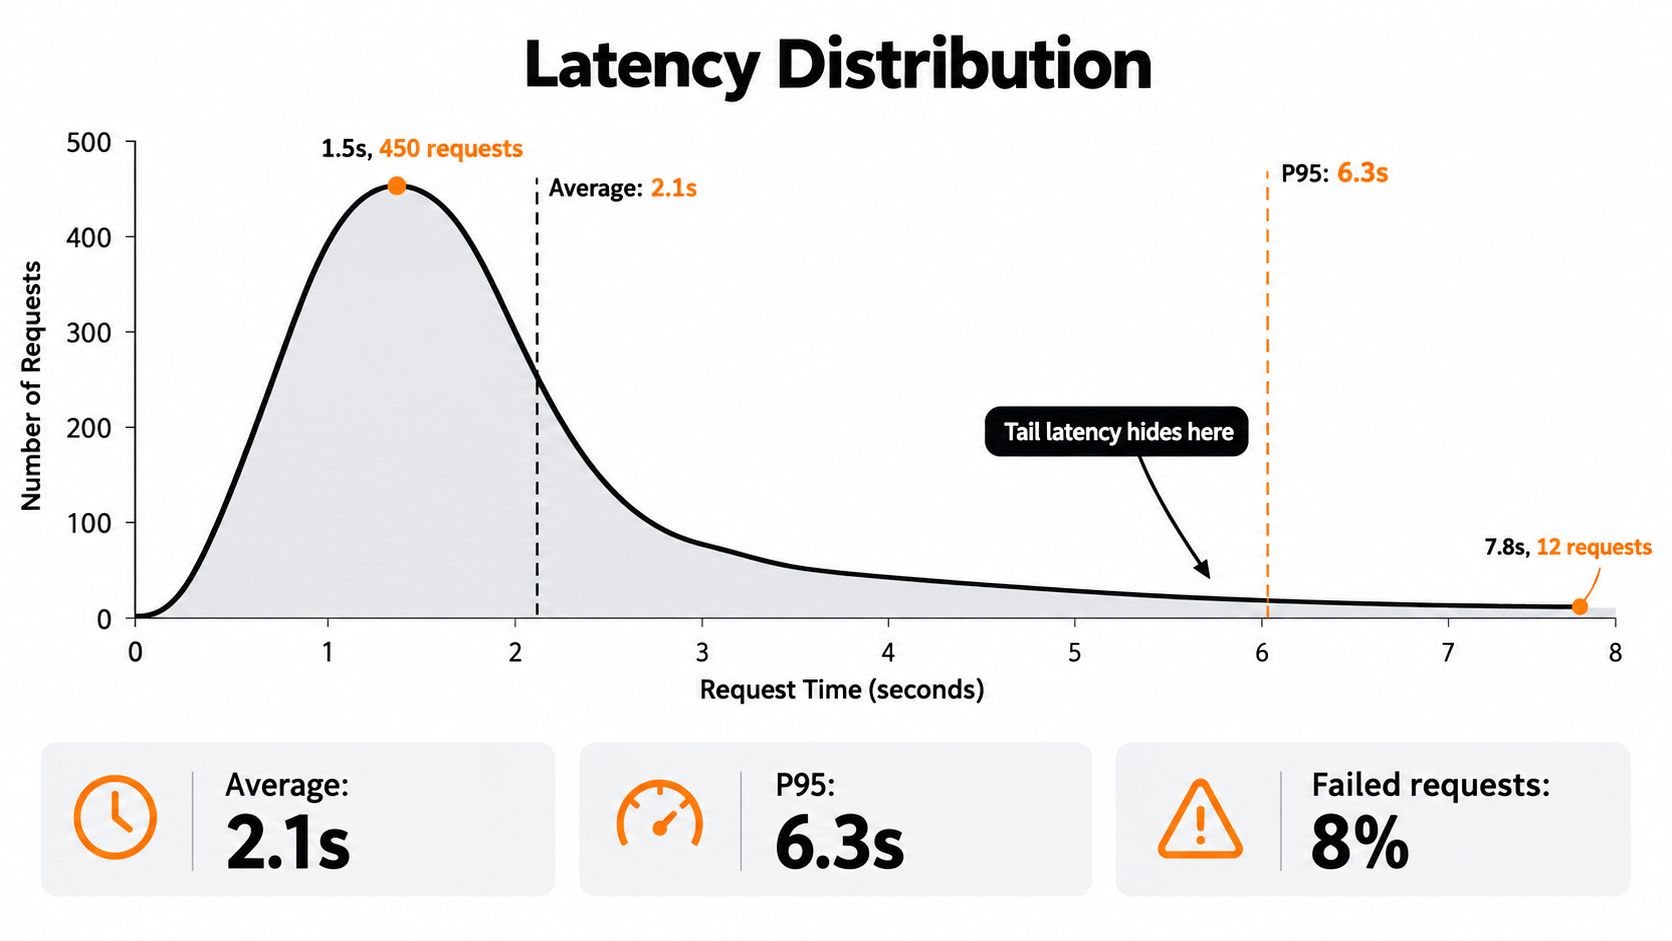
A support queue fills up after a provider slows down, yet the dashboard reports an acceptable average. That is how a latency problem survives review. Fast requests can outnumber a smaller set that waited long enough to break a workflow, trigger a timeout, or create a retry.
Google's SRE guidance recommends analyzing successful and failed-request latency separately, because combining them can conceal delays associated with failures. It also favors percentile views over averages, especially p50, p95, and p99, which expose the center and long tail of the distribution (Google SRE monitoring guidance).
Configure the chart for investigation
Use separate panels for:
- TTFT percentiles: p50, p95, and p99 by provider, model, region, and streaming mode.
- Completion percentiles: total duration across the same dimensions.
- Outcome overlays: successful requests, timeouts, rate limits, upstream failures, and client errors.
- Retry markers: first attempt, retry count, failover provider, and final outcome.
- Saturation context: queue depth, concurrency, connection pools, and provider rate-limit headroom.
A stable p50 does not clear a worsening p95. If p50 holds steady while p95 rises, investigate immediately. The tail may belong to one provider, customer segment, request type, or deployment, while the aggregate average hides the concentration.
Streaming workloads need a separate TTFT alert and historical view. Total latency can remain unchanged while TTFT worsens because of queueing or upstream contention. Users experience that delay as an unresponsive interface, even when the final completion arrives on time. Keep the application contract aligned with the Openbase streaming documentation so streamed responses are measured consistently.
Operational research analyzing 156 high-severity inference incidents found that, from April to June 2025, token generation increased about 1.27 times, while P75 time to first token rose by approximately 60 milliseconds and P75 total latency by about 80 milliseconds. The study connected those changes to saturation, KV-cache inefficiencies, and architectural bottlenecks (inference incident analysis). MLCommons has also reported that 20 to 50 tokens per second at the 50th percentile supports a smooth experience (MLCommons performance discussion).
A dashboard should identify whether delay came from queueing, model computation, provider degradation, a retry, or client-side processing. Separating those causes turns an alert into an owner, an investigation, and a routing decision.
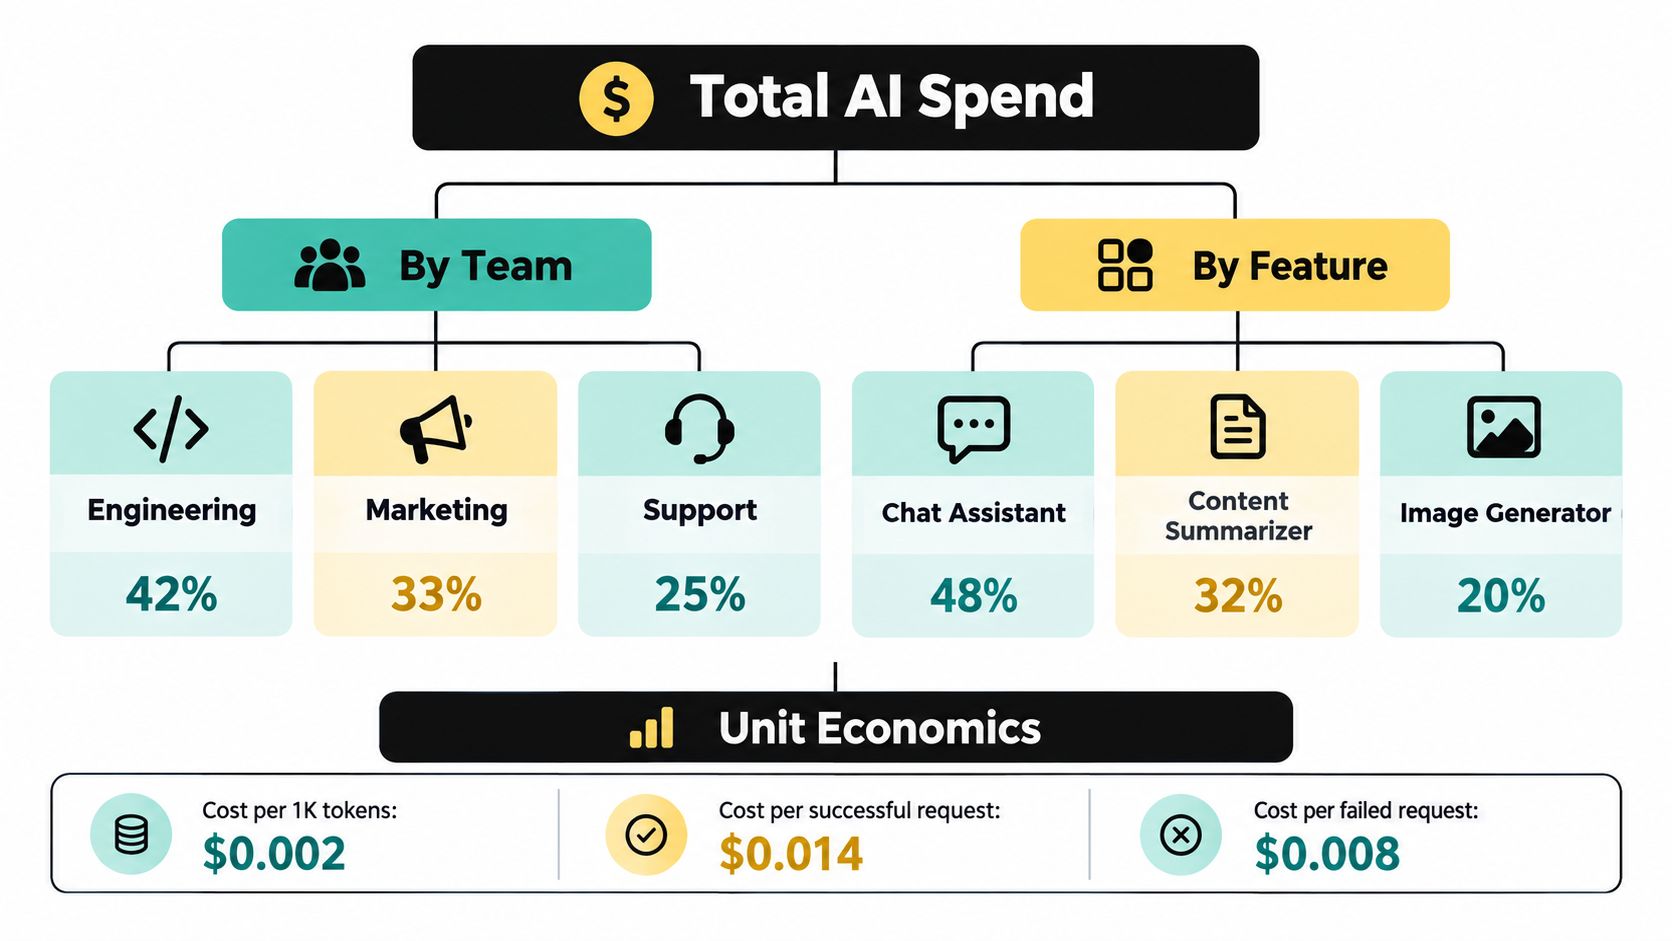
From Raw Spend to Cost Attribution and Unit Economics
Total spend is a lagging indicator. The finance question that matters is whether the organization can allocate that spend without a meeting full of guesses.
Assign ownership at request creation, not during month-end reconciliation. Store team, product, feature, customer, environment, release, and budget owner as immutable allocation fields. If an owner changes later, preserve the original record and apply the new organizational mapping in a separate reporting layer.
Turn signals into finance workflows
The four golden signals become useful to finance when each one maps to a decision:
- Traffic becomes a forecast: Volume by feature and tenant helps finance model demand instead of extrapolating from one invoice.
- Latency becomes a service commitment: A rising tail can explain why a team chooses a costlier provider for a user-facing workflow.
- Errors become a dispute trail: Failed attempts, retries, and provider responses clarify whether a charge reflects useful work.
- Saturation becomes a capacity budget: Queue depth and rate-limit headroom show when growth requires routing changes or reserved capacity.
The dashboard should explain anomalies, not merely color them red. A useful explanation might identify a release, a tenant, a model change, a retry burst, or a failover event as the dominant contributor.
Measure successful work
Cost per request is a weak business metric when requests can fail, retry, or produce unusable output. Track cost per successful task, cost per completed workflow, and cost per customer outcome where the application can provide that signal.
That requires joining gateway telemetry with product events. The gateway knows what was requested and billed. The application knows whether the user received a valid answer, completed a workflow, or abandoned the interaction. Keep those systems linked by request and task identifiers.
Teams should also compare forecast against actual spend at the same ownership level. The Openbase billing documentation describes the kind of per-request billing context a gateway can expose, but the broader principle applies to any implementation: exact cost records are useful only when finance can reconcile them to owners and outcomes.
Cost governance remains immature across many organizations. Recent observability research reports that cost is a major selection criterion for three-quarters of organizations, while 85% of respondents who find observability costs difficult to predict or budget for prioritize cost in tool selection. Yet only 15% report using FinOps in production (observability survey takeaways). More charts won't close that gap. Attribution, ownership, and a recurring decision process will.
How a Unified Multi-Provider Gateway Changes the View
Three provider portals create three versions of reality. Each has its own model names, billing exports, retry semantics, timestamps, and failure categories. A unified gateway creates one request contract and one event shape, even when the upstream route changes.
That matters most during failure. If a request starts with one provider and succeeds after a mid-flight retry through another, the dashboard should preserve both the original route and the successful route. Otherwise, the final invoice may look normal while operations misses the reliability cost of the failover.
Compare the alternatives directly
| Operating model | What finance sees | What operations sees | What remains difficult |
|---|---|---|---|
| Separate provider APIs | Several invoices and billing formats | Provider-specific dashboards | Cross-provider attribution and failover economics |
| Internal routing layer | A consolidated internal view if instrumentation is complete | Custom telemetry and routing data | Maintaining billing accuracy and model integrations |
| Unified gateway | One balance, request record, and invoice | Provider, model, latency, retries, and outcomes in one view | Designing ownership and outcome labels correctly |
A gateway should expose the true provider behind each event, preserve provider-prefixed model identifiers, and record the difference between an initial attempt and a retry. It should also account for input, output, and reasoning tokens where applicable, rather than presenting a single unexplained charge.
Use cost per task as the comparison lens
Suppose a team moves from three direct provider dashboards to one gateway view. The meaningful improvement isn't that the chart has more filters. It's that the team can compare cost per successful task, TTFT by provider, failover frequency, retry cost, and output volume using the same request dimensions.
Openbase is one example of this gateway approach. It provides an OpenAI-compatible interface, access to models from multiple providers, provider-prefixed model slugs, automatic failover, per-request token and latency logging, reasoning-token accounting, and consolidated billing. Evaluate those capabilities against your own routing, finance, and compliance requirements. The important design test is whether a provider change remains visible in the same cost and reliability record.
A Practical Checklist for Finance and Ops Teams
Start with a small dashboard that can support decisions today. Add complexity only when a team can name the decision that the new dimension will improve.
- Platform owner: Record every request with model, provider, input tokens, output tokens, reasoning tokens where available, TTFT, total latency, status, retry count, and exact cost.
- Finance owner: Require immutable allocation fields for team, feature, environment, customer, and budget owner before production traffic is approved.
- Operations owner: Chart p50, p95, and p99 TTFT and total latency separately for successful and failed requests.
- Routing owner: Track initial provider, final provider, failover reason, retry count, and whether any attempt produced billable output.
- Product owner: Join request records to task outcomes so the team can report cost per successful workflow, not just cost per API call.
- Finance and platform: Review forecast versus actual spend by owner, model, provider, and feature on a recurring basis.
- On-call owner: Alert on error classes, tail-latency shifts, queue depth, and rate-limit headroom, not every isolated slow request.
- Leadership team: Ask one question every review: which AI workflow became more valuable, less reliable, or more expensive, and what action follows?
Keep pricing assumptions and billing behavior documented alongside the dashboard. The Openbase pricing page is an example of the kind of published rate context teams can use when validating cost calculations, but your internal ledger still needs request-level reconciliation.
Openbase provides a unified gateway for accessing models from multiple providers through an OpenAI-compatible API, with per-request usage logs covering provider, model, tokens, latency, TTFT, and exact cost. Visit Openbase to evaluate whether consolidated billing, automatic failover, and finance-ready usage data fit your AI platform.