
You can ship a chat feature that feels solid in staging and still wake up to a larger bill, slower answers, and users correcting the assistant in production. The real question is which model answered, what it saw, how long each phase took, and whether the output was grounded.
That gap is why llm observability has become its own discipline. A 2025 framework breaks it into prompt and model provenance, retrieval and tool-call telemetry, output-quality signals, and cost and latency governance. A green uptime page can hide a broken product, and a working response can still be wrong, expensive, or unsafe.
Table of Contents
- Why LLM Observability Needs Its Own Discipline
- The Four Layers of LLM Observability
- What to Log on Every Request
- Reading Latency Beyond the p99 Number
- Building Cost and Usage Dashboards That Finance Trusts
- Evaluating Quality Without Slowing Every Request
- Why a Green Dashboard Can Still Mean a Failing Product
- A Minimum Viable Observability Operating Model
Why LLM Observability Needs Its Own Discipline
The first sign is usually a support ticket, a strange answer from a customer-facing assistant, or a finance report that no longer matches any single feature launch. The service is up, the chat window responds, and the dashboard stays green, but the system has already started drifting in ways classic application telemetry cannot explain.
Traditional monitoring was built around status codes, latency, and error rates. That helps for service health, but it does not tell you which model generated the answer, whether retrieval pulled the wrong context, or whether the response was grounded in anything real. The 2025 observability framework treats each request as a causal chain, from the selected model and retrieved context through tool execution and generated output, because that is how LLM failures surface. LLM observability framework
The failure is usually invisible at the HTTP layer
A retrieval-augmented assistant can return a valid response even when retrieval fetched junk. An agent can complete a tool call and still take the wrong action. A support copilot can answer quickly and confidently while inventing a citation that looks fine until someone checks it.
Classic application telemetry reports HTTP health but cannot identify which model generated a wrong answer. In production, observability has to include model identity, execution metadata, token usage, quality outcomes, and financial impact. Those fields let you ask the questions that matter, such as why an answer degraded after a prompt change or which provider drove a monthly bill spike. They also support incident diagnosis, performance tuning, compliance checks, and cost control without forcing you to guess where the problem started.
Practical rule: if a trace cannot explain the answer, the answer is not observable enough.
The Four Layers of LLM Observability
A single trace only helps when one trace ID ties together model choice, retrieval, output checks, and spend. Without that link, you get separate logs that are hard to reconcile and even harder to use during an incident.
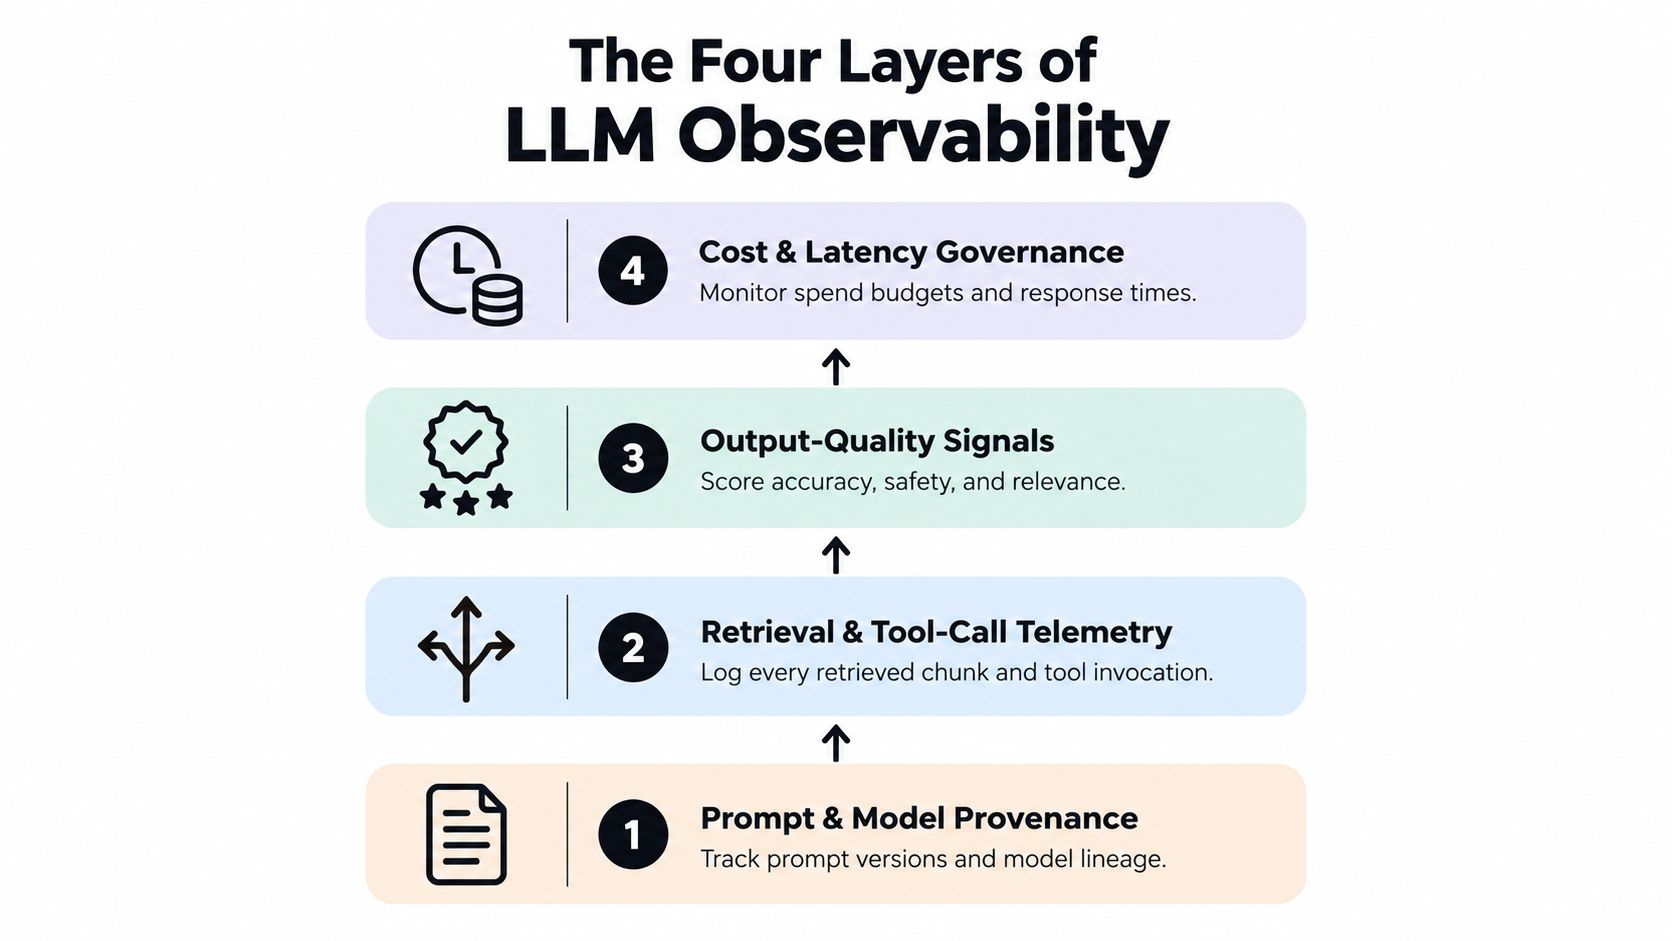
The four-layer framework makes the causal path explicit. Prompt and model provenance shows which prompt version ran, which model answered, and how the deployment lineage changed. Retrieval and tool-call telemetry records what context was fetched and which tools executed. Output-quality signals show whether the answer was valid, safe, and useful. Cost and latency governance tracks the economics and responsiveness of the request.
One request, one causal chain
A support request should carry the prompt template version, provider, retrieved snippets, any tool invocation, the output validation result, and the final cost. If the answer is wrong, the trace should show where the failure entered the chain instead of forcing an engineer to guess.
That is why per-request records need model identity, execution metadata, latency, token usage, quality outcomes, and financial impact. In practice, provenance fields help explain which version produced the behavior, retrieval fields show whether the model saw the right context, quality fields catch bad or unsafe output, and cost fields show whether a request was expensive because of prompt size, retries, or a slow upstream provider. Those fields let product, engineering, and finance read the same request history without rebuilding it by hand.
A useful way to think about the layers
- Provenance tells you what ran. The prompt, model, and deployment lineage explain which version produced the behavior. A good dashboard shows prompt version, model name, provider, and rollout tag side by side, so a regression after a prompt change is visible immediately.
- Retrieval and tools tell you what the model saw and did. Wrong context and failed tool actions surface here. Useful fields include retrieved document IDs, top-k context hashes, tool name, tool status, and tool latency. If retrieval quality is drifting, alert on a falling relevance score or a sharp rise in empty context returns.
- Quality tells you whether the response helped. Validity, groundedness, and policy checks sit here. Track validator pass or fail, citation coverage, refusal rate, and hallucination review outcomes. A spike in invalid answers is more useful than a vague “quality” score.
- Cost and latency tell you what it took to serve the request. Budgets and user experience meet here. Watch total cost, input tokens, output tokens, time to first token, and end-to-end latency, then set alerts when a model switch raises cost without a matching quality gain.
When those layers stay separate, dashboards look active but do not explain much. When they are linked, one trace search can move from symptom to root cause.
What to Log on Every Request
A production trace should be boring in the best way. Every request should carry the same core fields, so debugging does not depend on which engineer added which custom attribute that week. Missing fields turn root cause analysis into guesswork.
The non-optional request schema
Log the request arrival time, model identity, provider, input token count, output token count, latency, time to first token, completion timestamp, HTTP status, and cost. If the provider bills reasoning tokens separately, include that field too so the ledger matches the invoice. For streamed responses, record each streamed-token timestamp so you can separate user-perceived responsiveness from total completion time. The Openbase model docs show the same call-level fields for model, provider, token counts, latency, time to first token, and exact cost.
Here is the field set that pays off in postmortems.
| Field | Purpose | Layer |
|---|---|---|
| Trace ID | Correlates every event in one request | All layers |
| Timestamp | Orders events and makes replay possible | All layers |
| Model identity | Shows which model version answered | Provenance |
| Provider | Separates upstream behavior and cost | Provenance |
| Prompt hash or excerpt | Lets you debug without storing full bodies by default | Provenance |
| Input tokens | Explains prompt size and cost pressure | Cost and latency |
| Output tokens | Explains verbosity, spend, and decode load | Cost and latency |
| Retrieval trace | Shows which chunks or documents were used | Retrieval |
| Tool-call span | Exposes external actions and delays | Retrieval |
| TTFT | Measures delay before the first token appears | Latency |
| ITL | Measures decode smoothness and streaming pace | Latency |
| Validation result | Captures schema or policy failures | Output quality |
| Cost | Supports chargeback and reconciliation | Cost and latency |
Capture enough context without leaking everything
Full prompt capture sounds attractive until privacy, retention, and breach impact show up in review. Hashes plus sampled excerpts usually give enough detail to spot regressions while keeping sensitive content under tighter control. That also makes retention rules easier to enforce, and it gives you a clean place to redact personal or confidential data before the trace lands in a shared workspace.
Log prompt hashes with 100-character sampled excerpts by default. Retain raw bodies only for compliance-required fields.
Keep the raw body only where you must keep it. Most teams need the prompt shape, the version, and a safe excerpt far more often than they need every token forever.
Reading Latency Beyond the p99 Number
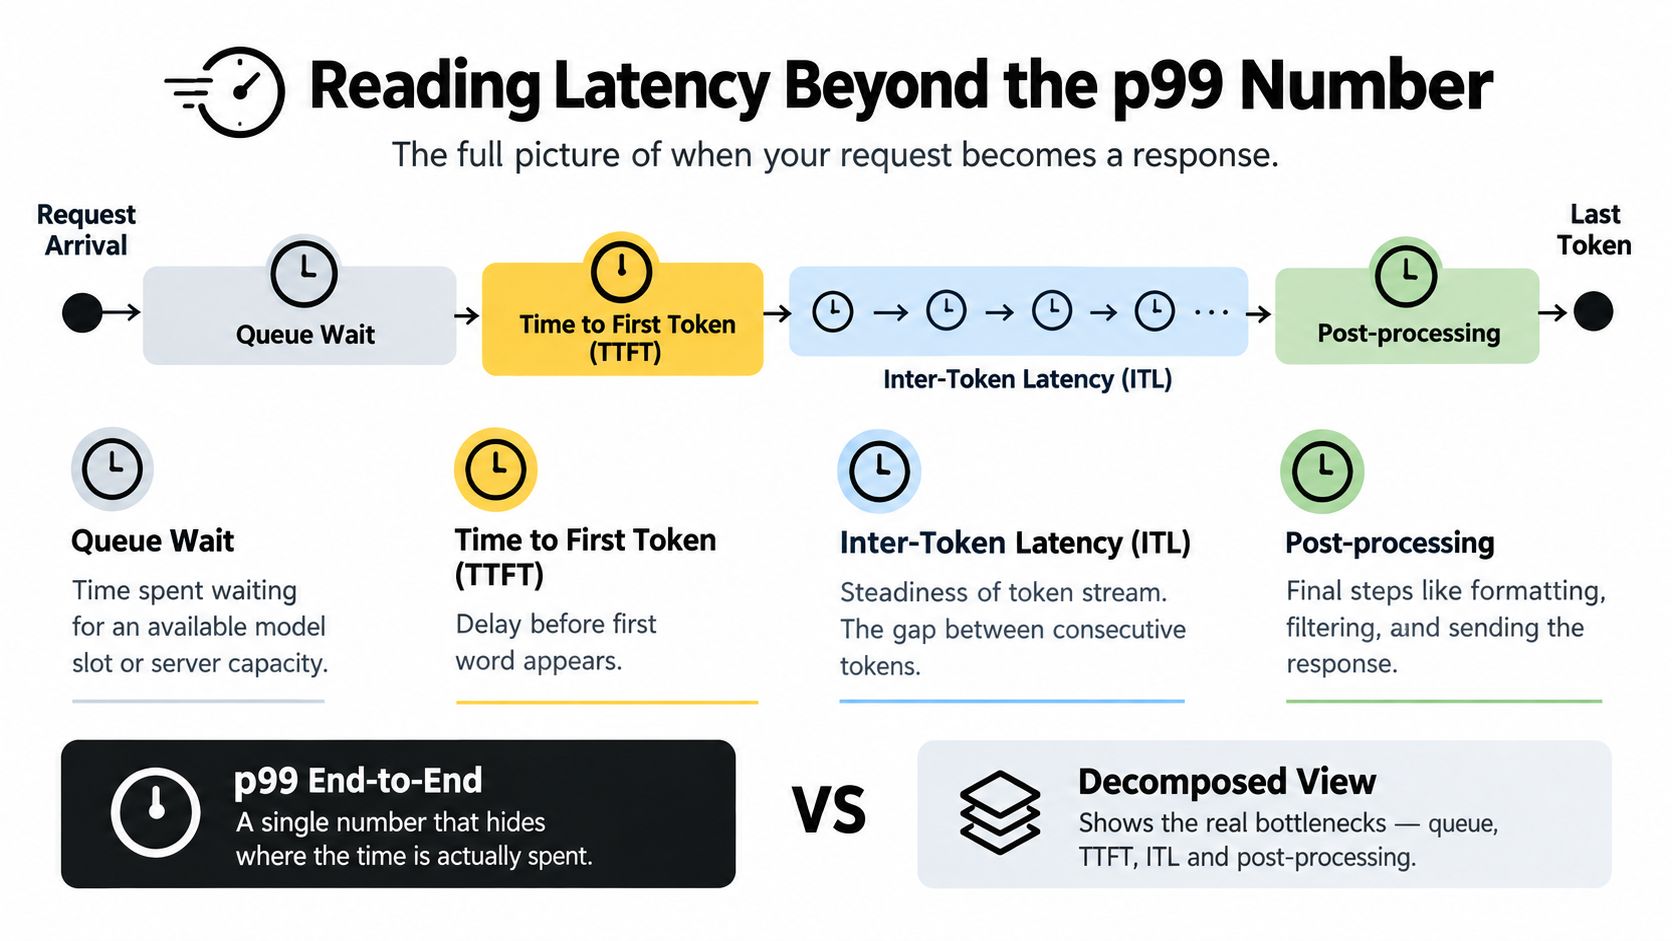
A single end-to-end latency number hides too much. A request can feel slow because the queue is backed up, because retrieval is expensive, because the model hesitated before emitting the first token, or because decoding itself is dragging. Those are different failures, and they call for different fixes.
The latency study breaks streamed latency into time to first token (TTFT) and inter-token latency (ITL). TTFT covers the prefill phase, while ITL measures each decode step. End-to-end latency is roughly TTFT plus the sum of all ITLs, so the trace should include request arrival, first-token time, every streamed-token timestamp, and completion time. Latency study
Read the trace, not just the aggregate
High TTFT usually points to prompt length, input processing, queueing, or retrieval overhead. High ITL points to decode-time compute, output length, batching, or GPU saturation. That split is the difference between trimming a prompt and scaling capacity in the wrong place.
If the first token is late, look upstream. If the stream stalls after that, look at decode pressure.
Cost belongs in the same view as latency, because a cheaper run can still be the wrong operational choice. Under 1,000 concurrent requests, an NVIDIA A10G-based g5.xlarge delivered the lowest measured cost per generated token in the reported run, at $0.1829 per million tokens, even though it was not the cheapest or fastest instance.
A trace format that supports routing decisions
Routing starts with a practical question: which provider and instance give acceptable TTFT, stable ITL, and reasonable cost for this workload? The trace should let you compare equivalent requests across providers and see whether the user felt the delay in the first second or the last.
Per-request latency fields need to sit next to provider and token data in the same row. If they are split apart, you cannot tell whether a slow response came from an oversized prompt, a model that decoded slowly, or a tool span that blocked the request. For streaming systems, a streaming trace format keeps those timestamps and spans aligned so the slow point is visible without reconstructing the request by hand.
Building Cost and Usage Dashboards That Finance Trusts
Finance doesn't want a model leaderboard. It wants an auditable view of what was used, by whom, and why the invoice moved. Engineering needs the same view, but sliced by provider, feature, and retry behavior so a cost spike doesn't become a blame session.
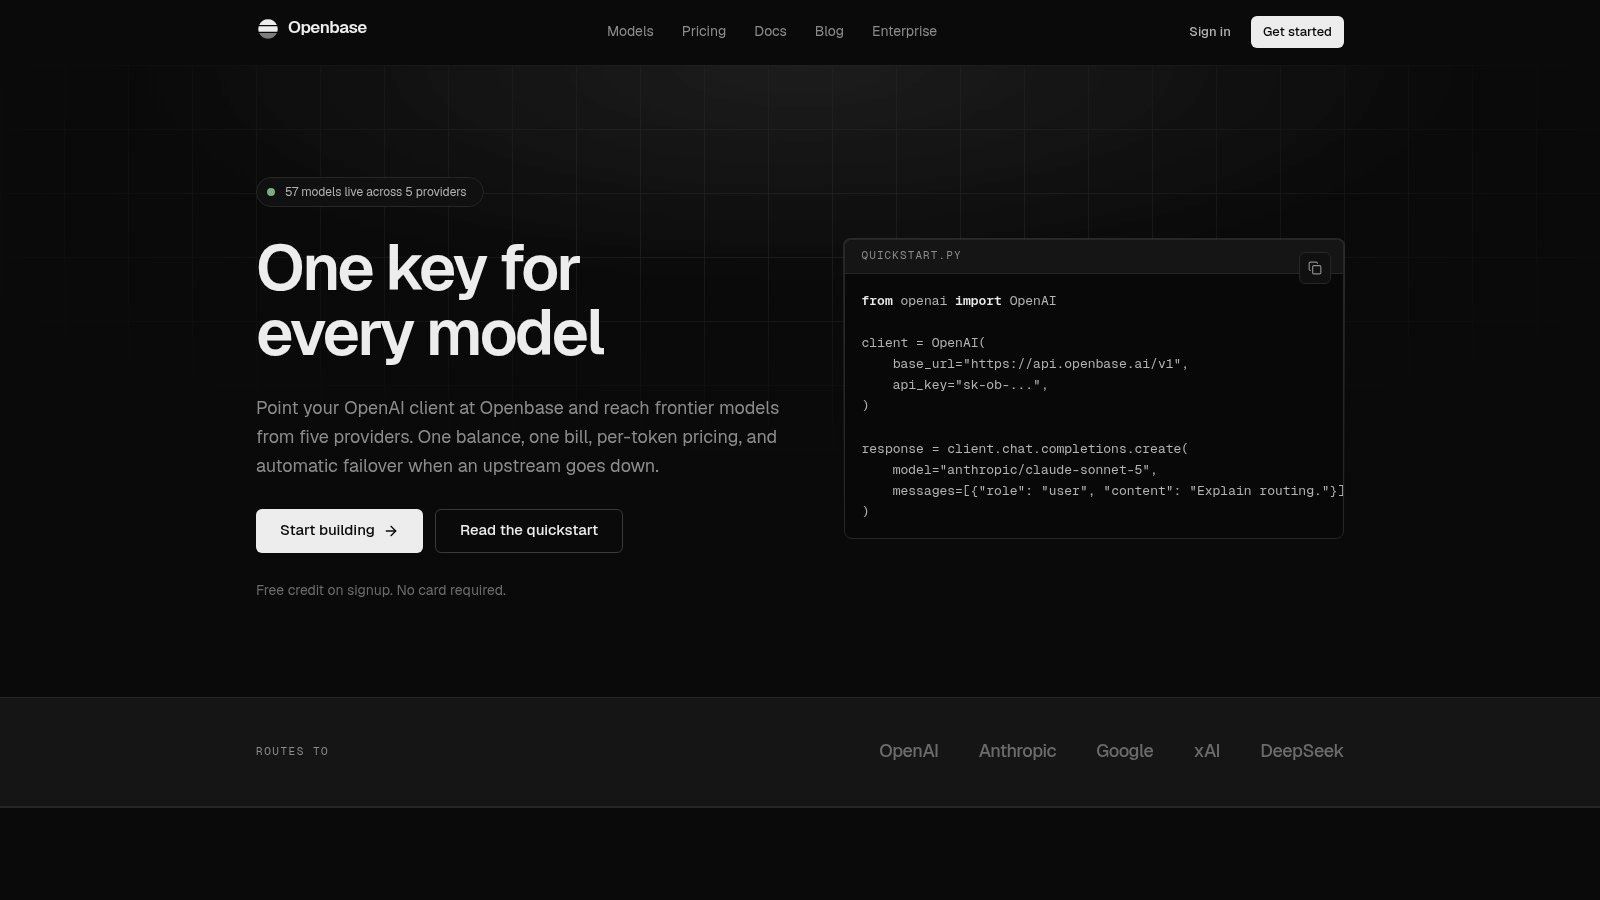
The useful dashboard starts with per-request metering and rolls up cleanly into per-provider, per-model, per-key, per-feature, and per-team views. That is the only way to reconcile daily usage with monthly invoices without rebuilding the data by hand. The Openbase billing docs cover consolidated usage and monthly invoice reconciliation in the same operating model. Openbase billing docs
Make spend legible to non-engineers
The dashboard should show exact cost per call, daily usage rollups, and retry traffic alongside the model and provider fields. That lets a product manager see whether a feature launch drove usage, and lets finance check whether the monthly invoice matches the operational record. If reasoning tokens are billed separately upstream, surface them separately in the dashboard too, or your internal numbers will drift from the provider's numbers.
A stable cost-per-call field matters for chargeback. Estimating cost later from partial logs is how teams end up debating the spreadsheet instead of the system. When the metering is attached at request time, you can attribute spend across teams without backfilling missing values.
What a workable rollup looks like
- Provider rollup: shows whether one upstream is becoming disproportionately expensive.
- Model rollup: reveals whether a new model version changed spend or token usage.
- API key rollup: helps isolate environment-level leaks or runaway experiments.
- Feature rollup: ties tokens and dollars to actual product surfaces.
- Team rollup: supports budget ownership without manual reconciliation.
Evaluating Quality Without Slowing Every Request
If you try to judge every answer synchronously, quality checking becomes its own latency problem. Production systems need a cheaper path: attach a trace ID, sample traffic, and run low-latency automated checks offline or asynchronously. That keeps the user path fast while still giving you quality data you can trust.
Sampled checks beat blanket judgment
One production-oriented hallucination system showed the trade-off clearly. The natural-language-inference and sentence-boundary models took about 1.2 and 1.3 seconds per request on a V100 GPU, while GPT-4 chain-of-thought evaluation took 7.9 seconds per API call. Hallucination system That's why sampled production pairs plus offline human review are usually the right shape for online monitoring.
The right checks are usually factuality, relevance, citation correctness, structured-output validity, and policy compliance. The point isn't to automate judgment into a black box. The point is to flag suspicious outputs quickly enough that humans only review the traces that matter.
Segment quality or miss the regression
Aggregate accuracy can hide a broken workflow. A model might look fine overall while a high-value prompt version degrades without notice. Segment every quality metric by model, provider, prompt version, retrieval configuration, and use case so a regression in one path doesn't get buried in a broad average.
A practical implementation is simple enough:
- Attach one trace ID to the request, response, retrieval, and tool spans.
- Store hashes or privacy-safe excerpts instead of full text everywhere by default.
- Sample input-output pairs into an asynchronous evaluator queue.
- Feed human review back into the same trace space for comparison.
- Keep evaluator disagreement visible, because uncertainty is part of the signal.
That last point matters more than teams admit. If a response is borderline, the disagreement itself tells you the evaluator isn't ready to be the source of truth.
Why a Green Dashboard Can Still Mean a Failing Product
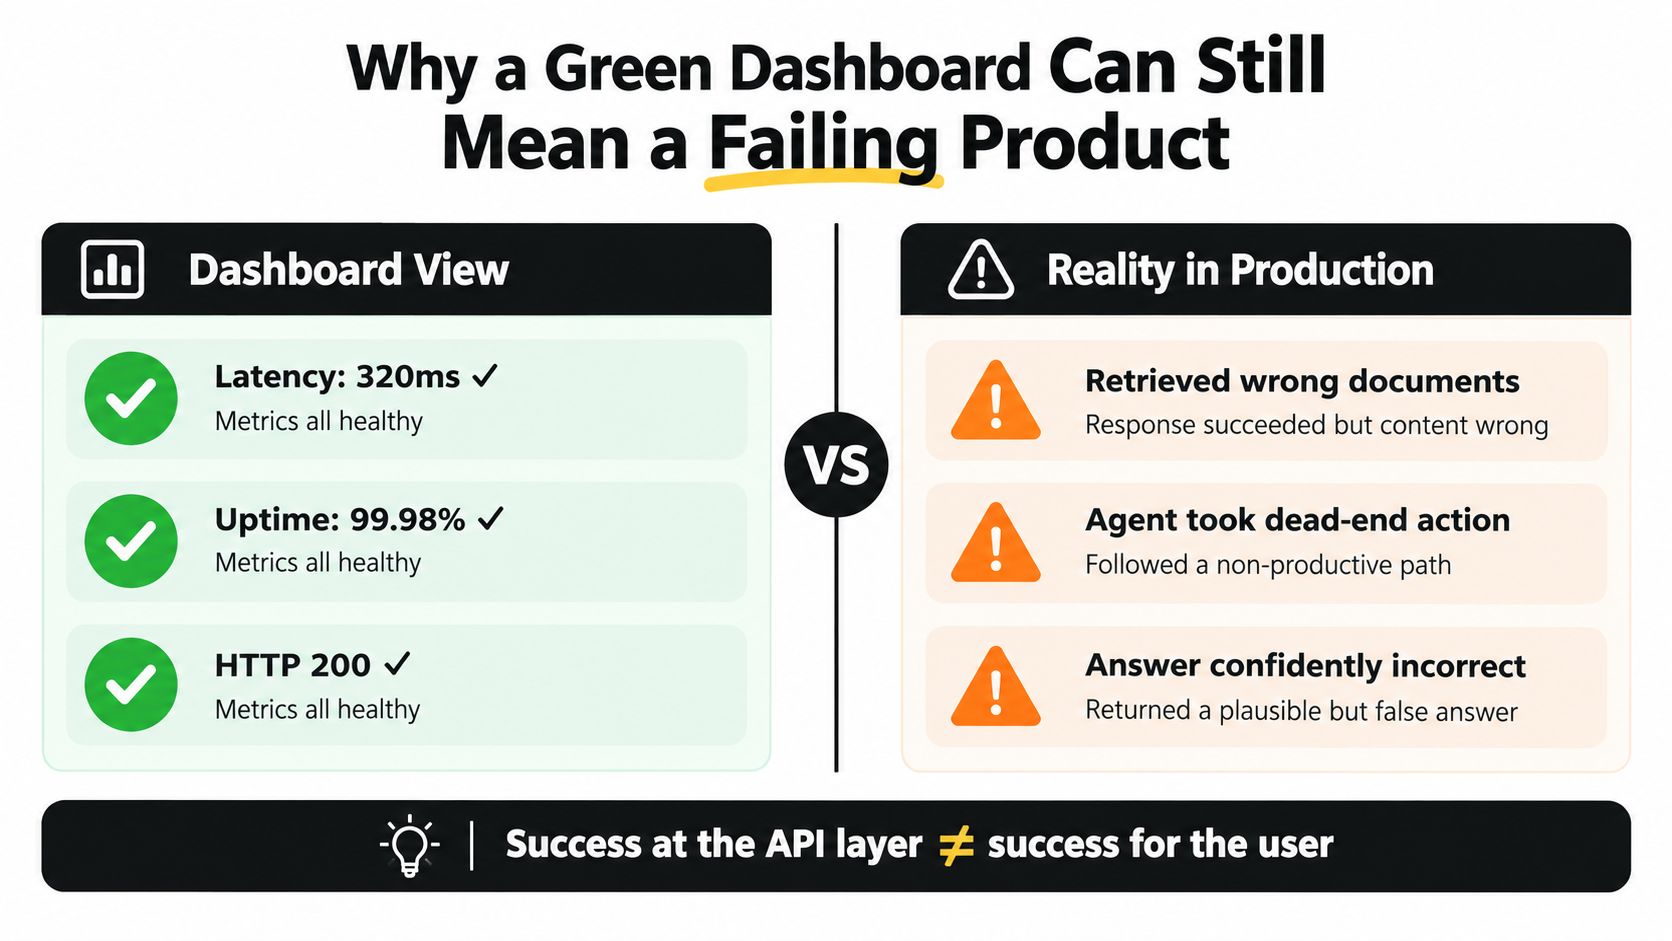
A healthy latency graph can coexist with a broken customer experience. That's common in agentic and retrieval-augmented systems, where a successful response can hide a failed retrieval, a bad tool result, or an answer that sounds confident and is still wrong.
A 2025 survey pointed to this gap directly, and it also noted documented incident cases, including an LLM share-link feature that reportedly made more than 100,000 conversations discoverable. Grafana survey The lesson is uncomfortable but useful, a green technical dashboard doesn't prove the product is safe, grounded, or useful.
Outcome labels are the missing layer
The next useful observability layer is outcome-based. Track whether a response had citation support, whether the task was completed, whether the user escalated, and whether the user corrected the answer. Those labels connect the system trace to actual business impact instead of only infrastructure health.
Success at the API layer doesn't mean success for the user.
That's especially true when a product team ships an assistant that acts on behalf of the user. A request can complete, a tool can return, and the workflow can still go off the rails. If you record the failure only as a latency or error issue, you miss the part that matters most.
A Minimum Viable Observability Operating Model
Small teams don't need a bespoke telemetry empire. They need a minimum sufficient operating model that makes production debuggable without making privacy and compliance worse. The cleanest approach is three layers, request-level operational telemetry, workflow-level traces, and periodic outcome evaluation with a versioned test set and sampled human review.
Start with data minimization. Keep the fields that support debugging, routing, and billing, then add retention limits and explicit access controls before broadening access. Use hashes and privacy-safe excerpts by default, redact personal or confidential data early, and document lineage so anyone reviewing a trace knows where it came from and how long it lives.
Set escalation thresholds for the things that hurt operations most, cost spikes, latency regressions, safety failures, and provider outages. Those thresholds should page different owners. A cost breach is a finance and platform problem, a safety failure is a product and compliance problem, and a provider outage is a routing and resilience problem.
A good rollout sequence is straightforward:
- Instrument request traces first. Get model, provider, token, latency, and cost fields into one row.
- Add retrieval and tool spans next. Don't debug multi-step workflows blind.
- Layer in sampled quality checks. Use async evaluation instead of slowing every user request.
- Build segment-level dashboards. Compare model versions, providers, and prompt variants.
- Tighten retention and access last. Keep the data useful without making it overexposed.
More telemetry isn't automatically better. Indiscriminate prompt capture can increase breach impact and compliance burden, so the target is minimum sufficient telemetry with clear ownership. If you can't answer why a field exists, it probably doesn't belong in the default trace.
Openbase gives teams centralized per-request logging for model, provider, token usage, latency, time to first token, and cost, which fits the observability model described here. If you're wiring LLMs into production and want one place to see spend, routing, and response behavior, visit Openbase and evaluate whether its gateway matches your stack.