
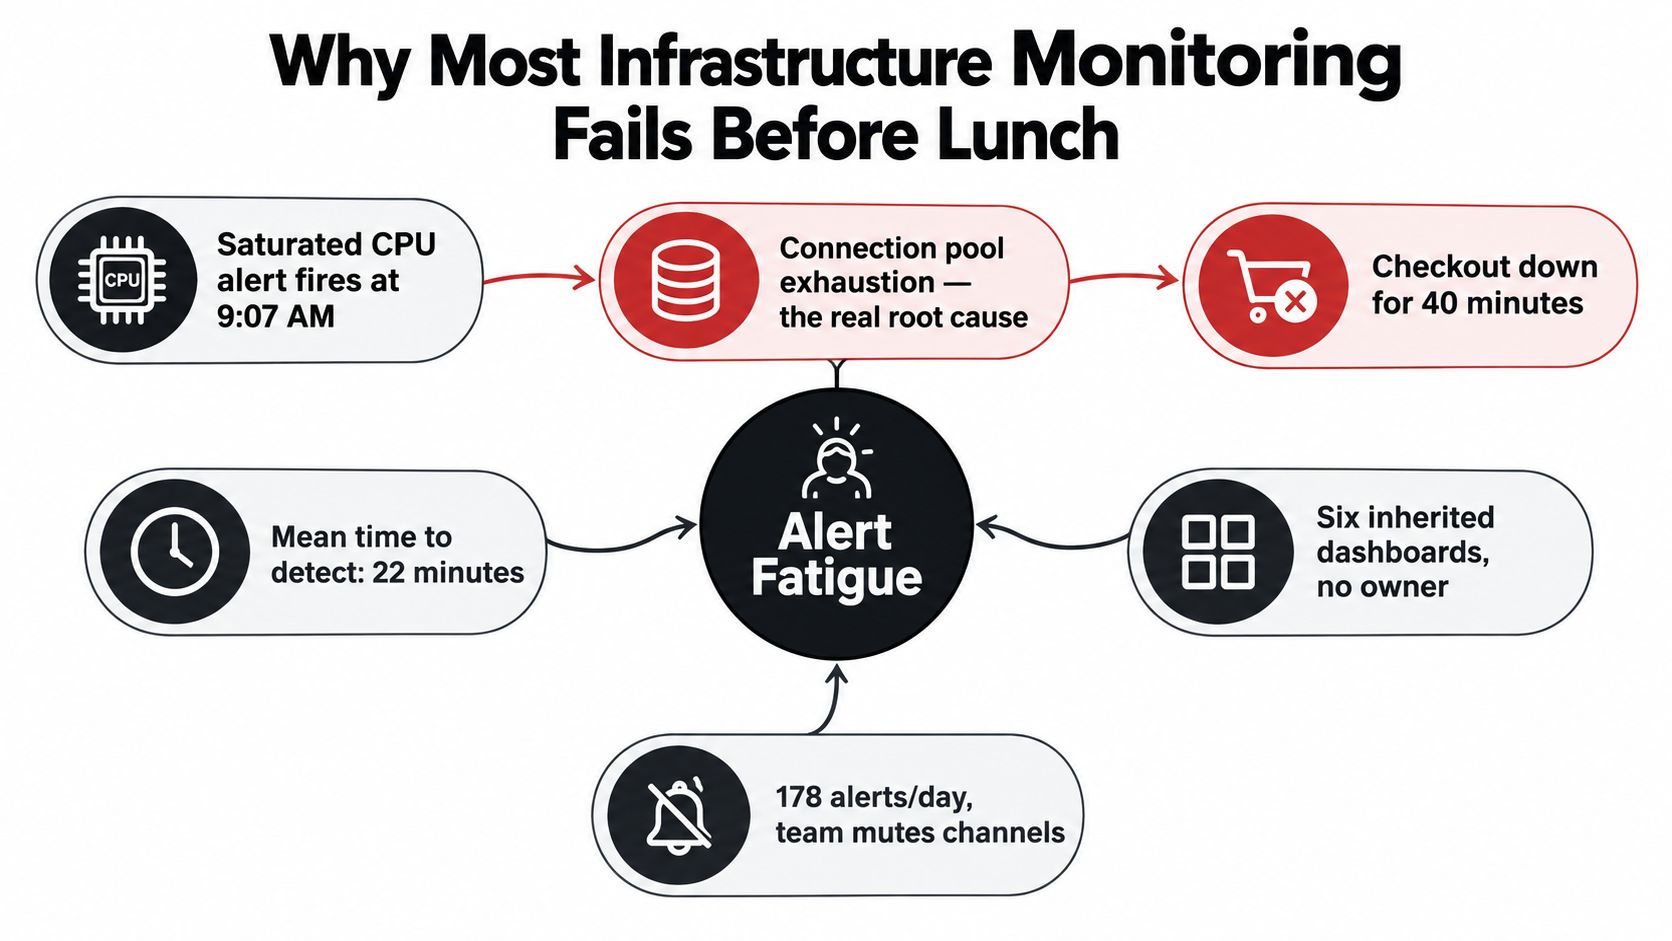
You're on call when the monitoring system starts shouting about CPU saturation across several hosts. The alerts look urgent, but the checkout team is reporting something worse: requests are timing out. Buried beneath the noise is a database connection pool that has exhausted its available connections. By the time someone finds the relevant signal, customers have been unable to complete checkout for forty minutes.
That incident is common in estates assembled incrementally. One team installs an agent, another adds a dashboard, and a third creates alerts for every metric that moves. Nobody agrees what healthy means, who owns each signal, or which conditions deserve a page. The result is plenty of visibility and very little operational clarity.
To monitor IT infrastructure effectively, treat monitoring as a cost and resilience design problem, not a graph-collection exercise. The useful questions are simple: which customer journeys matter, which signals identify failure early, who responds, and how much telemetry can the organization afford to retain? A deliberately designed stack produces fewer pages, faster recovery, and a defensible infrastructure budget.
Table of Contents
- Why Most Infrastructure Monitoring Fails Before Lunch
- The Four Telemetry Pillars Every Stack Needs
- Designing a Layered Collection Architecture
- Turning Signals into Alerts and SLOs That Matter
- Comparing the Leading Monitoring Platforms
- The Hidden Economics of Monitoring at Scale
- A 30-Day Starter Plan and Common Anti-Patterns
Why Most Infrastructure Monitoring Fails Before Lunch
A checkout service can remain online while its database connection pool approaches exhaustion. The monitoring stack may page the team for a short CPU spike, yet say nothing about the dependency that is delaying customer requests. By the time an operator correlates the signals, the incident has already become expensive.
This pattern appears in estates assembled over years. One team maintains host dashboards, another monitors databases, and a third tracks cloud resources. Each view may be accurate in isolation, but none defines the service objective, identifies the owner, or shows which dependency deserves attention first. The organization pays for overlapping telemetry while responders still lack a clear path to action.
The three design failures
Alert fatigue makes paging unreliable. Independent industry research found that only 18% of incidents were actionable, so adding more alerts can increase response cost without improving resilience. A page should mean that someone must act now. A threshold crossing that has no customer or service consequence belongs on a dashboard. (LogicMonitor's infrastructure monitoring guidance recommends prioritizing high-signal metrics and limiting alert overload.)
Unclear ownership extends the incident before diagnosis even begins. A database condition may reach the application team, although the platform team owns the database and the network team owns the path to it. A service map, named owner, and escalation policy prevent the first responder from spending the highest-impact minutes locating the right person.
Demo-friendly dashboards also fail under pressure. Attractive charts and dense summaries do not show the details an operator needs: the affected service, the dependency that changed, the current error budget, and the next runbook action. A dashboard should support a decision, not display every metric the system can collect.
Practical rule: If an alert does not identify customer impact, an owner, and a next action, keep it on a dashboard or report instead of the primary paging path.
The financial case is direct. One widely cited outage estimate places the average cost of an unplanned IT outage at $14,056 per minute, while the Uptime Institute's 2023 outage analysis found that 60% of surveyed operators had experienced an outage during the prior three years. (The IT infrastructure monitoring market analysis summarizes these outage findings and their operational implications.)
A useful monitoring program therefore targets fewer false pages, faster mean time to recovery, and better control of telemetry spend. Collecting every available signal can undermine all three by increasing storage, routing, and investigation costs without improving decisions.
The Four Telemetry Pillars Every Stack Needs
A checkout request slows after a deployment. Host CPU remains normal, yet customers see delays. Metrics expose the symptom, events provide timing, traces locate the delay, and logs identify the failure mode. Each pillar answers a different incident question, so removing one forces operators to guess.
| Pillar | Incident Question Answered | Framework | Example Data |
|---|---|---|---|
| Metrics | Is something degrading right now? | USE or RED | CPU utilization, request duration, error rate, connection count |
| Logs | What did the code or system do? | Structured fields and correlation IDs | Database timeout, authentication failure, retry decision |
| Traces | Where did latency accumulate? | Span timing across dependencies | Checkout request, payment call, slow query |
| Events | What changed before the symptom? | Change and deployment context | Release, configuration push, scaling action |
Metrics show state and direction over time. Counters record work and errors, gauges capture current values, and histograms show distributions such as request latency. For infrastructure, the USE method examines Utilization, Saturation, and Errors. CPU utilization alone rarely explains an incident. Pairing it with run-queue saturation and scheduling errors gives the operator evidence about both demand and contention.
Services need a different lens. The RED method measures Rate, Errors, and Duration. A host can have comfortable CPU headroom while its service returns errors or responds too slowly. RED keeps monitoring tied to the request path, rather than treating host health as a substitute for customer health. That distinction also helps control alert volume, because pages can reflect an SLO breach instead of every unusual host reading.
Logs explain behavior that metrics summarize. A structured record containing a request ID, dependency name, error class, and retry count can separate a rejected database connection from a slow query. Unstructured text remains useful for uncommon diagnostic details, but relying on it alone makes search, correlation, and retention more expensive.
Traces locate delay across service boundaries. A latency metric can show that checkout is slow; a trace can reveal that the payment service responded quickly while the database span consumed most of the request time. Events complete the timeline. A deployment, scaling action, certificate rotation, or configuration change may explain why several otherwise unrelated signals shifted together.
Use the pillars as a diagnostic sequence:
- A duration metric detects rising checkout latency.
- An event shows a deployment shortly before the change.
- A trace identifies a slow database span.
- A log reveals connection-pool exhaustion and the affected configuration.
- A service alert routes the incident to the team that owns the checkout dependency.
The goal is a small signal set that supports decisions, not an archive of every available field. Google SRE monitoring guidance supports choosing signals that expose service health and actionable failure modes, then expanding collection only when new data improves diagnosis. This approach reduces ingestion and investigation cost while preserving the evidence needed to restore service.
Designing a Layered Collection Architecture
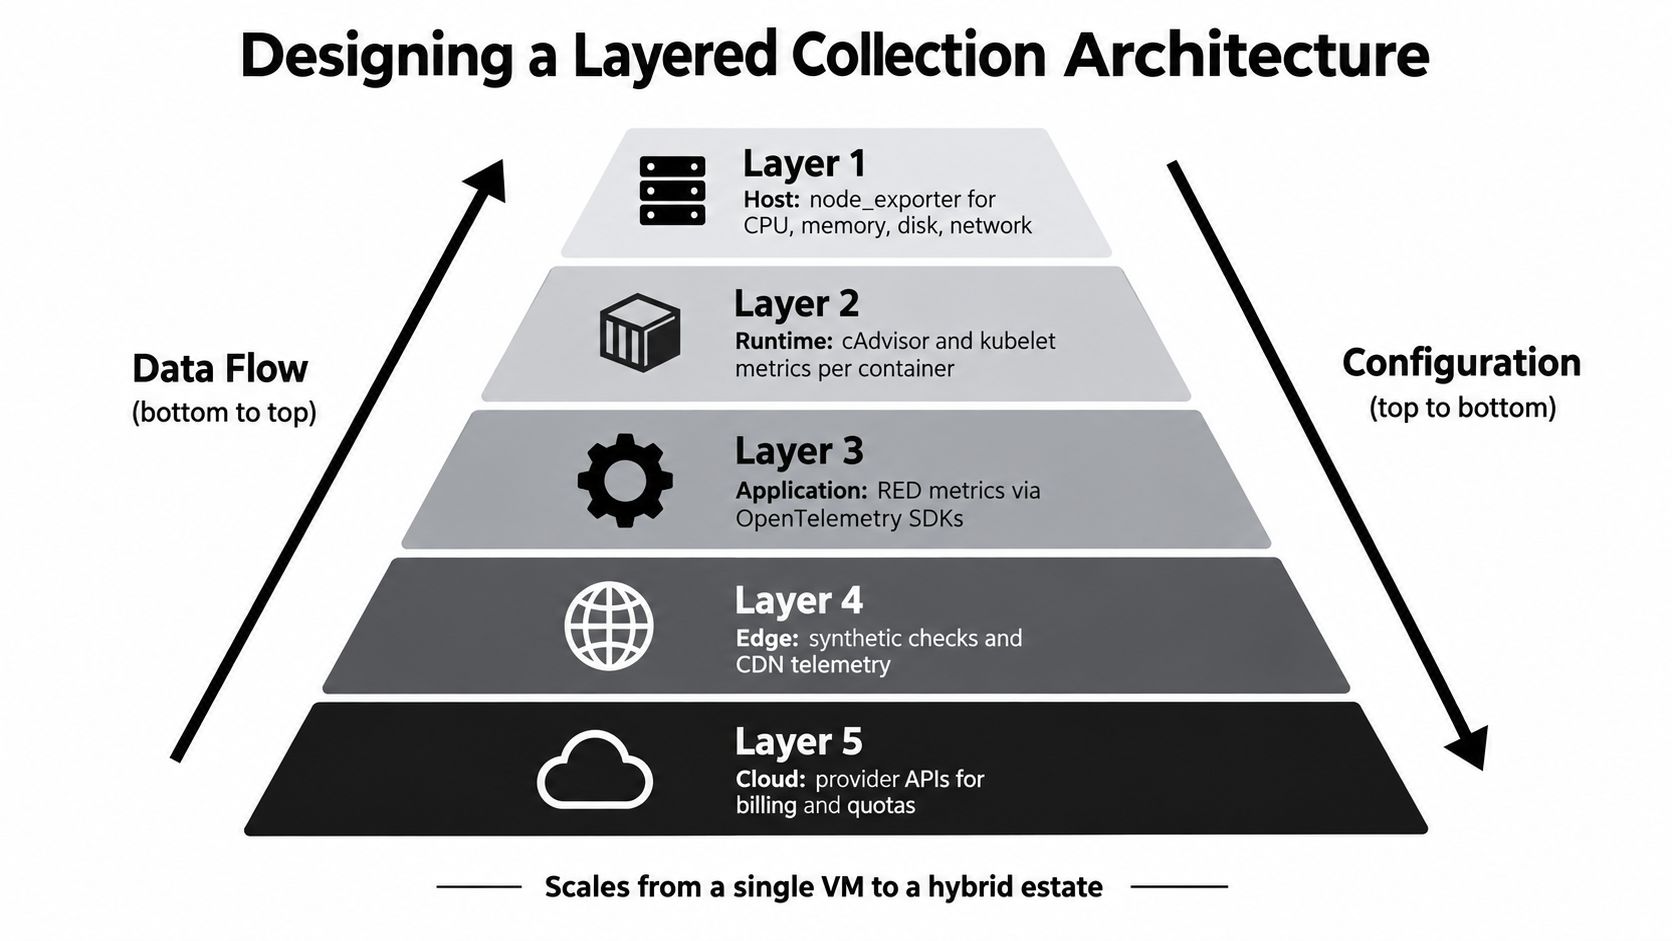
A collection architecture should mirror the estate. A single virtual machine needs host telemetry and endpoint checks. A hybrid environment adds containers, managed services, cloud APIs, and external paths. The safest approach is to add layers without asking every collector to understand every technology.
Layer one and layer two
Host telemetry covers CPU, memory, disk, and network for physical machines and virtual machines. An OS-level agent or a category such as node_exporter fits this layer. Baseline these signals for every monitored asset, then attach ownership and environment labels that help operators filter without multiplying time series unnecessarily.
Runtime telemetry covers containers and orchestration. Kubernetes teams can collect kubelet and cAdvisor data, alongside container runtime and workload state. ECS environments need equivalent task, service, and cluster signals. Focus on resource requests, throttling, restart behavior, pending work, and node pressure. Container identity changes quickly, so avoid labels that create a new series for every transient identifier unless that detail is essential during diagnosis.
Layer three through layer five
Application telemetry exposes RED metrics and distributed traces through OpenTelemetry SDKs or equivalent instrumentation. Add request route, status class, dependency, and service ownership. Be careful with unbounded labels such as raw URLs, user IDs, or request bodies. They may look useful during development but can make production storage and queries harder to control.
Integration telemetry connects the monitoring system to cloud provider APIs, managed databases, message queues, load balancers, and storage services. AWS CloudWatch, GCP Monitoring, Azure Monitor, database exporters, and queue integrations belong here. Provider metrics often contain capacity, quota, and billing context that host agents can't see.
Synthetic and black-box checks test the system from outside the trusted network. Probe critical endpoints, authentication paths, DNS resolution, and key transaction steps. These checks answer a question internal telemetry can't: can a user reach and complete the service from the intended location?
Control the collection boundary
Push collection and processing to a gateway or OpenTelemetry Collector when direct export from every workload would create unnecessary egress, duplicated configuration, or unpredictable storage. A collector can batch, filter, enrich, sample, and route telemetry before it reaches a backend. That also gives the platform team a controlled place to remove noisy fields and enforce retention rules.
Use streaming documentation when your monitoring or AI integration needs responses delivered incrementally rather than waiting for a complete payload. The same operational principle applies to telemetry pipelines: define what must arrive immediately, what can be buffered, and what can be sampled.
Turning Signals into Alerts and SLOs That Matter
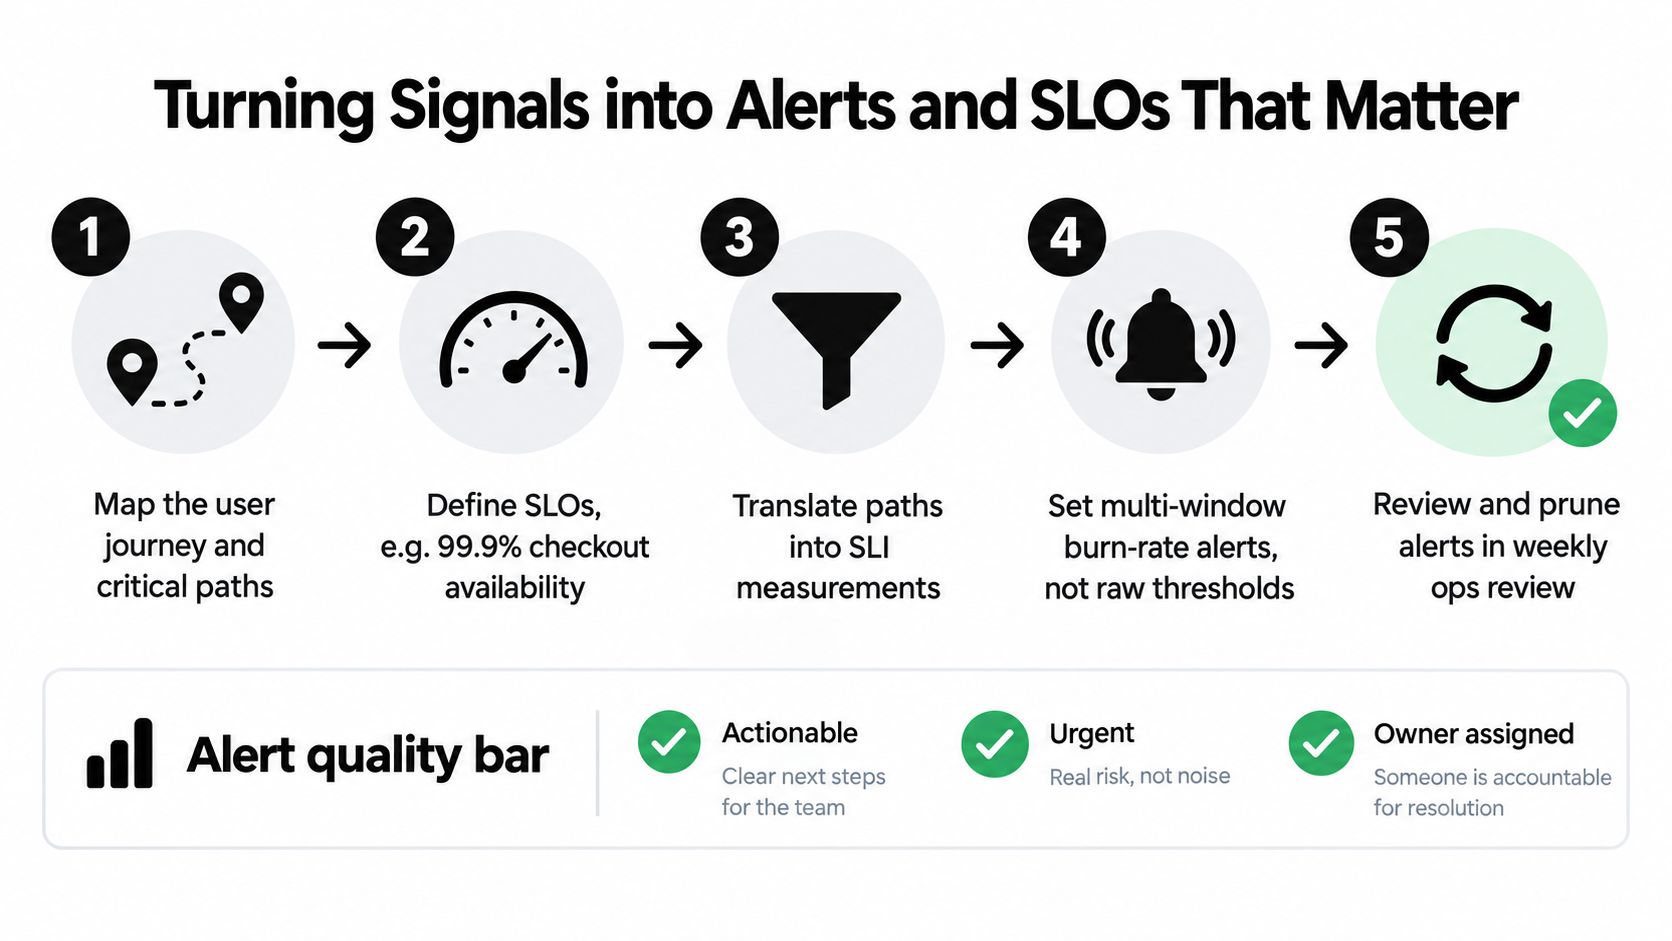
A payment service can look healthy while customers fail at checkout. CPU may stay within limits, yet latency, dependency errors, or incomplete transactions can make the service unusable. Start with the user journey, identify its critical paths, and define service-level indicators that show whether those paths work.
For checkout, useful indicators include successful completion, request duration, dependency errors, and saturation in the systems handling the transaction. Reduce each path to a small set of golden signals: latency, traffic, errors, and saturation. Add availability or durability objectives where they reflect the service outcome. An SLO should describe something the service owner can influence, rather than a machine condition that is merely convenient to collect.
The error budget follows directly from the objective:
Error budget = (1 minus SLO) multiplied by request volume over the measurement window.
Use the formula to set operating boundaries, not to produce another report. If a service burns its remaining budget quickly, slow risky releases, investigate the dominant failure mode, or prioritize reliability work. If the budget remains healthy, the team has evidence to keep shipping within the agreed risk boundary. This connects monitoring decisions to delivery risk and prevents telemetry costs from growing without a corresponding resilience benefit.
Alert for budget consumption, not isolated movement
Multi-window burn-rate alerts provide better control than raw thresholds. A fast window can detect a severe incident that warrants an immediate page. A slower window can expose sustained degradation early enough for the team to intervene before the budget disappears. Set the windows and thresholds according to service criticality, traffic patterns, and responder capacity. Copied defaults often create noise or miss the failure mode that matters.
Given the low actionable-incident rates discussed earlier, every page should pass three tests:
- Actionable: the responder has a defined next step.
- Urgent: waiting for the normal review cycle creates meaningful risk.
- Owned: the route names a responsible team and escalation path.
A production page should include a runbook link, affected service, observed SLI, relevant dependency, and required severity. Severity should describe the response, not the drama of the graph. A warning can enter a work queue. A confirmed SLO breach with active customer impact can page the primary responder.
Alert design is a compression problem. Reduce a large telemetry stream to the small set of decisions an on-call engineer must make under pressure.
Measure detection and recovery separately. A 2025 research report found a median MTTR of 43 minutes for organizations with observability, compared with 2.9 hours for organizations without it. (Netdata's 2025 research on dashboard gaps during outages provides that comparison and discusses alerting, testing, and dashboard quality.) The practical lesson is not that a tool automatically shortens recovery. Teams need measurements for detection, response, and recovery, then must use them to refine routing, thresholds, runbooks, and ownership.
Comparing the Leading Monitoring Platforms
Platform selection should follow operating constraints, not feature-count comparisons. The important trade-off is usually between control and portability on one side, and managed onboarding and integrated capabilities on the other.
| Platform | Cost Model | Lock-in Risk | Hybrid Support | AI Workload Ready | Best Fit |
|---|---|---|---|---|---|
| Prometheus plus Grafana | Infrastructure, storage, and operating effort | Lower at the data and query layer | Strong with exporters, but integration work remains | Requires deliberate GPU and job instrumentation | Teams optimizing control and portability |
| Datadog | SaaS usage based on hosts, telemetry, and product modules | Higher because workflows and data models are proprietary | Broad managed coverage | Strong managed integrations, subject to plan and data coverage | Teams prioritizing time to value |
| New Relic | SaaS usage based on telemetry and platform use | Moderate, with a broad agent model | Good coverage with integration planning | Suitable where AI monitoring is part of the wider platform | Organizations standardizing on one agent approach |
| Dynatrace | SaaS platform and monitored data or entity consumption | Higher due to platform-specific workflows | Strong for complex hybrid estates | Strong automated analysis and enterprise integrations | Large environments needing managed depth |
| OpenTelemetry-native stack | Collector, backend, storage, and engineering costs | Lower at instrumentation, backend choice remains separate | Strong when teams operate the pipeline | Flexible, but AI-specific work is usually custom | Teams building for portability and tailored control |
Prometheus plus Grafana usually wins when the team can operate storage, upgrades, federation, and alerting itself. The financial model is more visible, but the labor model isn't free. Engineers still need to maintain exporters, design dashboards, manage retention, and integrate cloud and SaaS dependencies.
SaaS suites reduce that operational burden and often provide broader integrations sooner. The trade-off is less control over data models, retention economics, and migration paths. High-cardinality telemetry can make a convenient platform expensive if teams don't govern collection.
Match the platform to the estate
For Kubernetes on bare metal alongside AWS accounts, an OpenTelemetry Collector with Prometheus-compatible metrics offers portability, but the team must connect exporters, cloud APIs, tracing, storage, and alert routing. Datadog or Dynatrace can reduce glue code when hybrid coverage and managed workflows matter more than backend independence. New Relic sits between those choices for organizations that want a unified agent model without building every integration themselves.
AI workloads add another selection test. The platform needs GPU utilization, training or inference job state, queue depth, model latency, and cost context. A vendor may support some of these natively, but the team should verify the actual fields, retention behavior, and ownership model before procurement.
The sensible verdict is narrow. Choose OpenTelemetry collectors plus Prometheus when portability, customization, and cost control dominate. Choose Datadog or Dynatrace when hybrid scope, managed integrations, and time to value dominate. Choose New Relic when a single agent model and broad platform coverage fit the organization's operating style.
The Hidden Economics of Monitoring at Scale
A monitoring bill can grow while incident response gets worse. Grafana's 2025 survey found that observability spend averages 17% of total compute infrastructure spend, making dashboards, retention, labels, and duplicate collectors budget decisions, not just engineering preferences. (Grafana's 2025 observability survey reports the spending share and describes the pressure created by growing telemetry complexity.)
The expensive failures are usually cumulative: verbose logs retained without a use case, labels with excessive cardinality, duplicate agents forwarding the same host data, and dashboards nobody opens after an incident. A metric may be inexpensive alone, then become costly across every workload, environment, route, and ephemeral identity.
Govern the telemetry budget
Use a review checklist that connects each signal to an operational decision:
- Remove unused views: Archive dashboards with no owner, linked service, incident, or review workflow.
- Cap label cardinality: Keep stable dimensions such as service, environment, region, and status class. Reject raw identifiers unless they support a documented investigation.
- Sample at the edge: Filter routine records before export, while preserving errors, slow requests, and traces tied to active incidents.
- Set signal-based retention: Keep high-value incident data longer than verbose debug output. Define the policy in the pipeline instead of leaving it to individual teams.
- Consolidate collectors: Remove overlapping agents and route common signals through a controlled gateway.
Retention and cardinality policies should also be visible to finance and service owners. Use billing documentation to understand how usage, token counts, and cost records can be exposed for an AI-facing integration. The useful question is specific: which telemetry costs the most, who owns it, and what decision does it support?
Tool sprawl adds a human cost. During an incident, engineers switch between dashboards, reconcile different timestamps, and check whether two systems measure the same service differently. Grafana's survey also found that 85% of organizations were using or evaluating unified application and infrastructure observability. The same survey supports that adoption figure. Consolidation is therefore an operating decision, not merely a branding preference.
Monitoring earns its place as a resilience investment when it improves response at a controlled cost. More data does not guarantee better diagnosis. Precise alerts, clear ownership, and dependable context reduce wasted on-call effort and keep attention on failures that threaten customers.
A 30-Day Starter Plan and Common Anti-Patterns
A new monitoring program doesn't need a grand migration. It needs a short sequence that produces evidence, removes noise, and connects telemetry to response.
The first four weeks
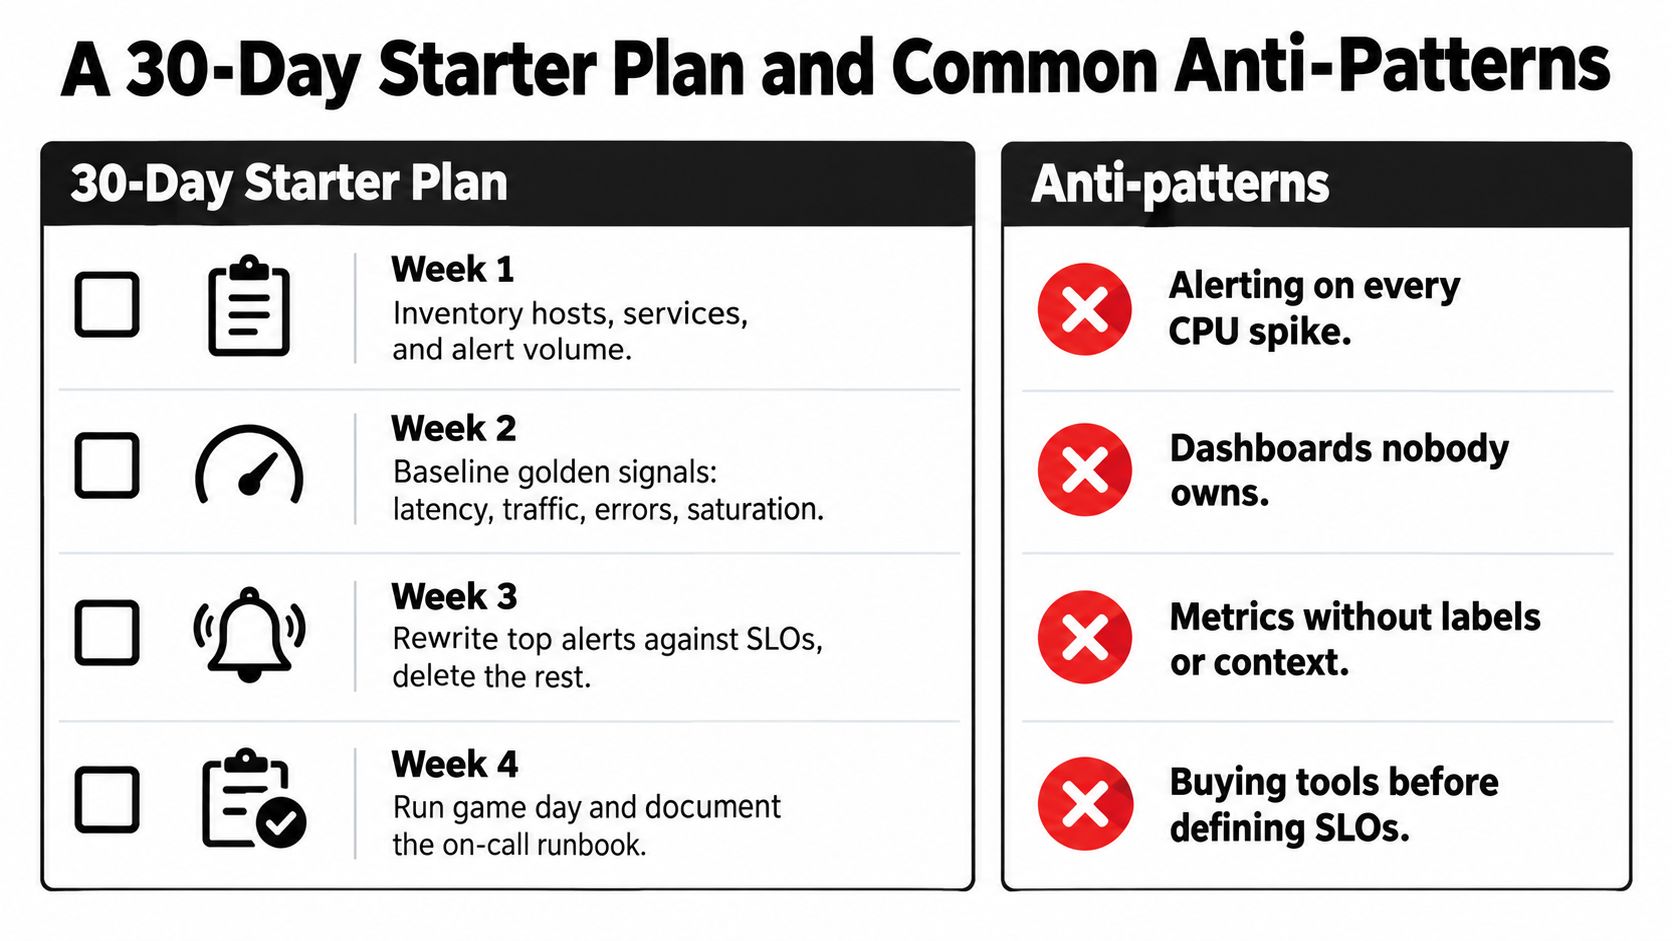
Week one, inventory. List hosts, services, dependencies, owners, critical user journeys, existing collectors, dashboards, and alert volume. Mark signals that page nobody, route to the wrong team, or duplicate another system.
Week two, baseline. Establish latency, traffic, errors, and saturation for the most important services. Add host, database, storage, and network metrics where they explain those service outcomes. Delete redundant collectors before adding new integrations.
Week three, define response. Write SLOs for critical paths, create error-budget alerts, and route them through PagerDuty or Opsgenie. Attach a runbook to every page and test escalation with a controlled exercise.
Week four, retire and rehearse. Remove legacy dashboards, document ownership, run a game day, and review whether responders found the right signal quickly. Keep the alerts that led to action and revise or delete the rest.
Anti-patterns that keep returning
- Monitoring CPU instead of user-facing latency: Host pressure matters when it explains a service failure, not when it merely moves.
- Using unguarded thresholds: A brief spike shouldn't page unless it predicts customer impact or violates a service objective.
- Allowing dashboard sprawl: A view without an owner becomes another place to search during an incident.
- Treating logs as the default fallback: Logs need structure, correlation, sampling, and retention rules. They can't replace service metrics and traces.
- Skipping alert review: After every incident, ask which alert detected the problem, which alerts distracted the responder, and which missing signal delayed action.
Practical questions from hybrid and AI teams
How should a hybrid estate spanning on-premises VMware and EKS be monitored? Keep ownership and service objectives consistent across both environments. Collect hypervisor, guest, Kubernetes, network, and application signals through a common context layer, then use synthetic checks to validate the path from outside each environment.
What should an AI workload add to the monitoring model? Track GPU utilization, queue depth, job state, model latency, failed requests, and cost drift. The important question is whether the workload is delivering its intended service, not whether every accelerator is busy.
How do teams begin without replacing everything? Start with the highest-impact journey and its current failure modes. The Openbase quickstart documentation can support an API integration where model requests, provider information, latency, token usage, and cost need to be observed alongside the surrounding service.
A monitoring stack earns its place when it shortens decisions under pressure. Inventory what you have, define what healthy means, remove signals nobody acts on, and test the remaining path before the next incident tests it for you.
Openbase provides an OpenAI-compatible gateway for multiple model providers, with automatic failover and per-request records for model, provider, token usage, latency, and cost. If your platform team is operating AI services and wants that application-level telemetry connected to infrastructure and reliability workflows, visit Openbase to evaluate the integration.